

📈📉 Time to Go Long on Stacks (STX)!
📈📉 Time to Go Long on Stacks (STX)!

Overview:
Chart #1 - TOTAL 1-Day Chart
Chart #2 - Stacks (STXUSDT) 1-Day Chart
Chart #3 - Curve DAO (CRVUSDT) 1-Day Chart
Chart #4 - USDT Dominance (USDT.D) 1-Day Chart

Real Vision membership packages help you understand the complex world of crypto and macro, with real in-depth analysis!
Get your membership package 👉 here, and benefit from SPECIAL Crypto Banter discounted prices!
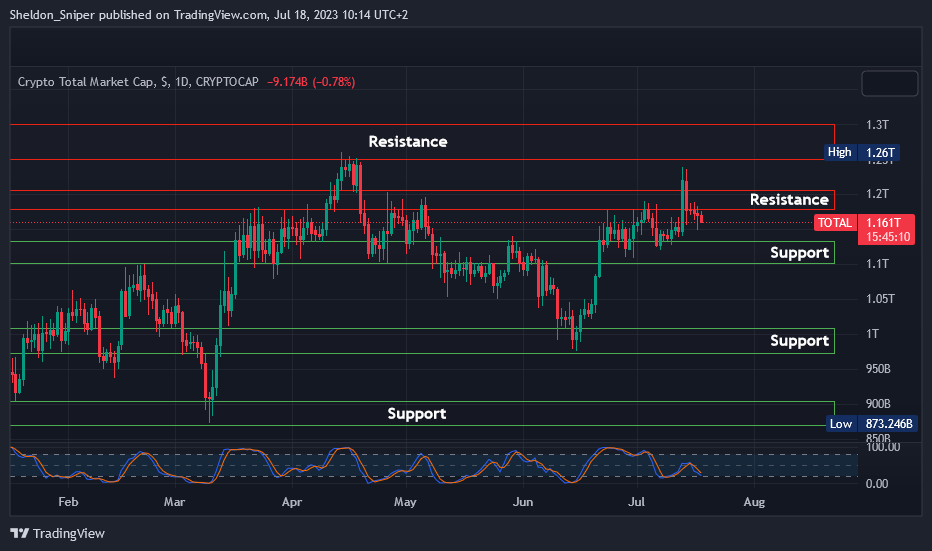
Chart #1 - TOTAL 1-Day Chart
Chartist: Sheldon
(For the chart screenshot, click here.)
Last week, the TOTAL tried to breach the $1.25T - $1.3T resistance area, but it was rejected again, just like in April.
This repetition could potentially be a double top, a possibly bearish sign for the market.
Currently, the TOTAL is at $1.16T, having dropped under the $1.18T - $1.2T resistance zone. It appears to be trending downward towards the next support area at $1.1T - $1.15T, a zone that has held for the past four weeks. If the market once again finds support within the $1.1T - $1.15T range, it could potentially provide opportunities for long trade entries.
Sign-up and trade on Bybit today.
Exclusive $30,000 deposit rewards and bonuses up for grabs!
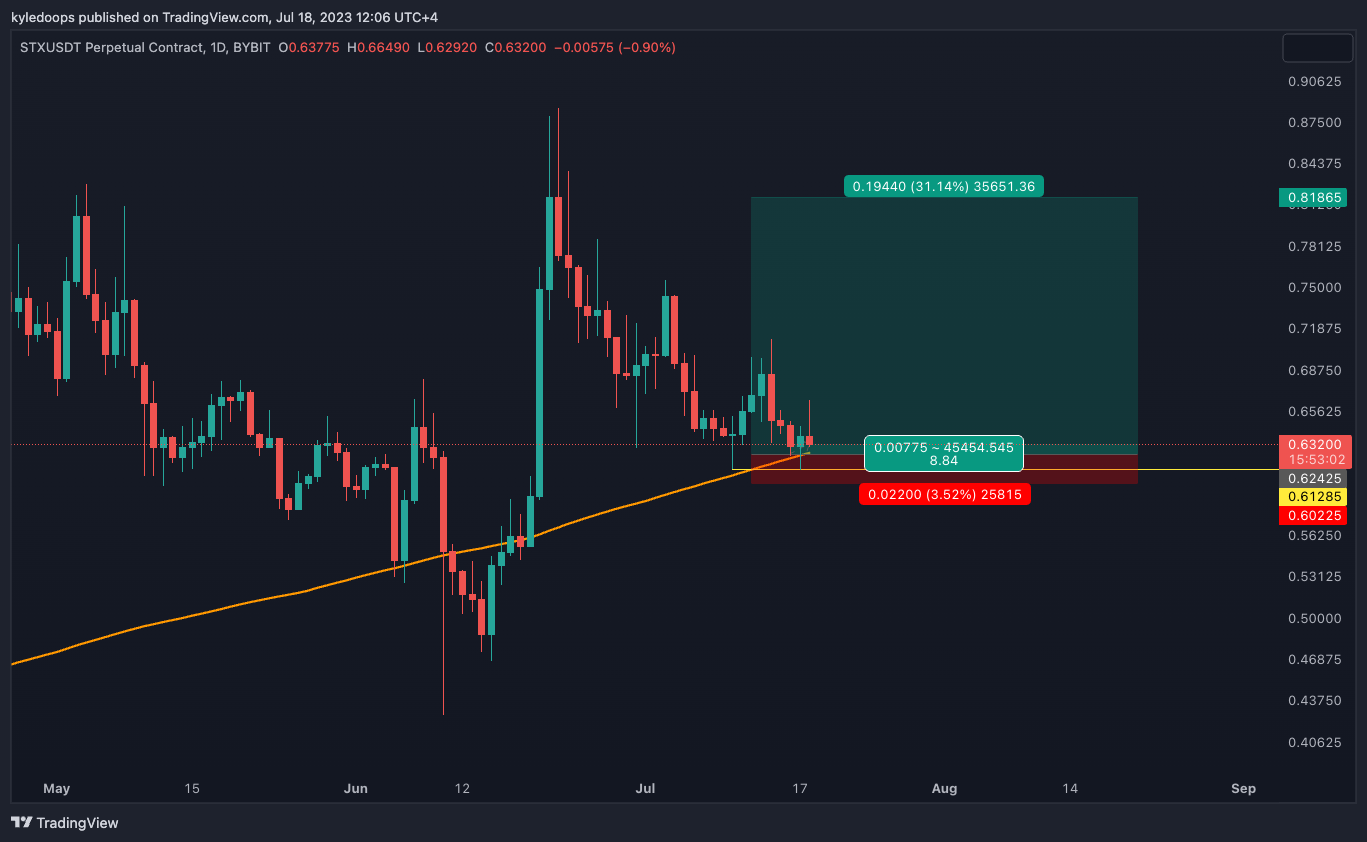
Chart #2 - Stacks (STXUSDT) 1-Day Chart
Chartist: Kyle
(For the chart screenshot, click here.)
On the daily timeframe, STX is aligning perfectly with the 200-day moving average, all while maintaining an uptrend characterized by higher highs and higher lows.
This presents a very favorable risk-to-reward trade opportunity with a stop set below Monday's low.
My entry is roughly at $0.632, with a stop loss at $0.6022, and a take profit level of $0.81.
𝗣𝗿𝗶𝗺𝗲 𝗫𝗕𝗧
Sign up for a new Trading Account on Prime XBT!
Receive a deposit bonus of up to $7,000 with promo code: KyleDoops

Sign up for a new Trading Account on Prime XBT!
Receive a deposit bonus of up to $7,000 with promo code: SheldonSniper
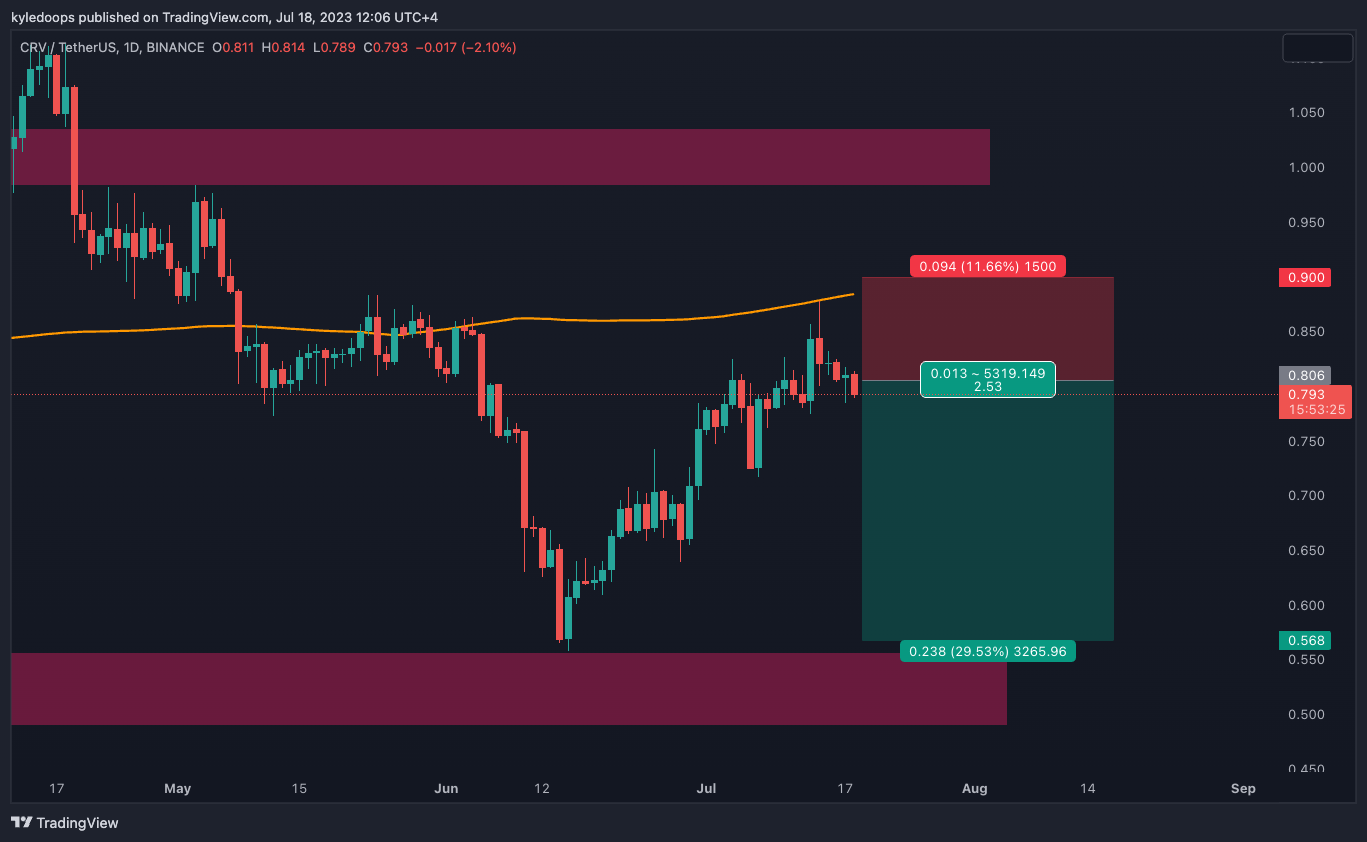
Chart #3 - Curve DAO (CRVUSDT) 1-Day Chart
Chartist: Kyle
(For the chart screenshot, click here.)
Yesterday, we presented a BNB short trade idea.
If BNB sells off, it's likely to pull the rest of the crypto market down with it. This proposed trade serves as an additional short position, acting as a hedge in the event that BNB does indeed drag the crypto market lower.
The stop would be set if the price reclaims the prior wick, which reached the 200-day moving average.
Thus, the stop is set at $0.90, with an entry point at $0.80 and a take profit of $0.568.
Claim your Bitget sign-up bonuses here (details below).
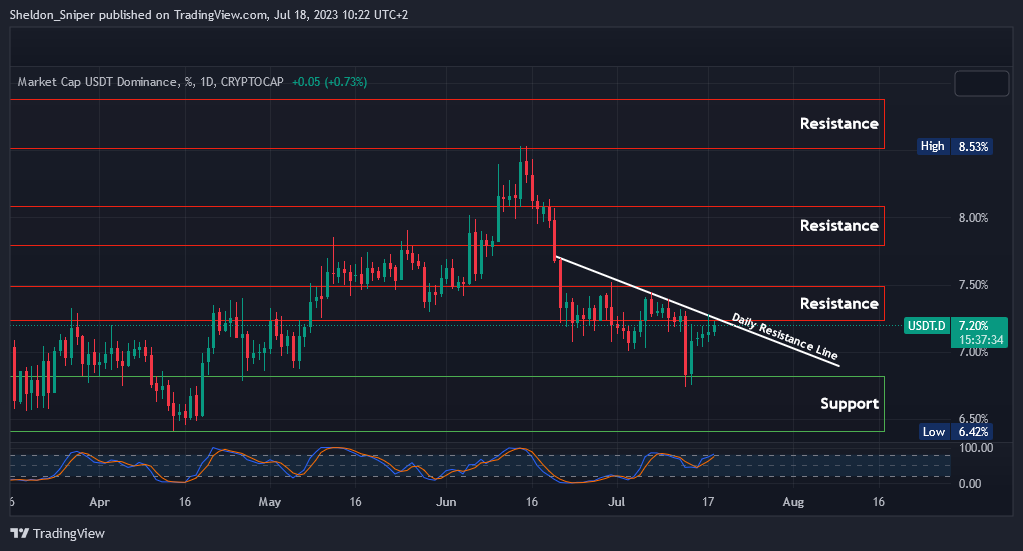
Chart #4 - USDT Dominance (USDT.D) 1-Day Chart
Chartist: Sheldon
(For the chart screenshot, click here.)
USDT Dominance began a retrace in the middle of June.
It retraced from 8.53% down to 6.75%, before finding support and heading back up to 7.25% - 7.5%, which is where the USDT currently stands. A breakthrough in both the current resistance and the daily descending resistance line will not be good, as cash leaves the market and moves into the safety of USDT.
But, a rejection here, accompanied by a reversal back to the downside, will be bullish for the market, as cash flows from USDT into the trading coins.
Claim your Bitget sign-up bonuses here (details below).
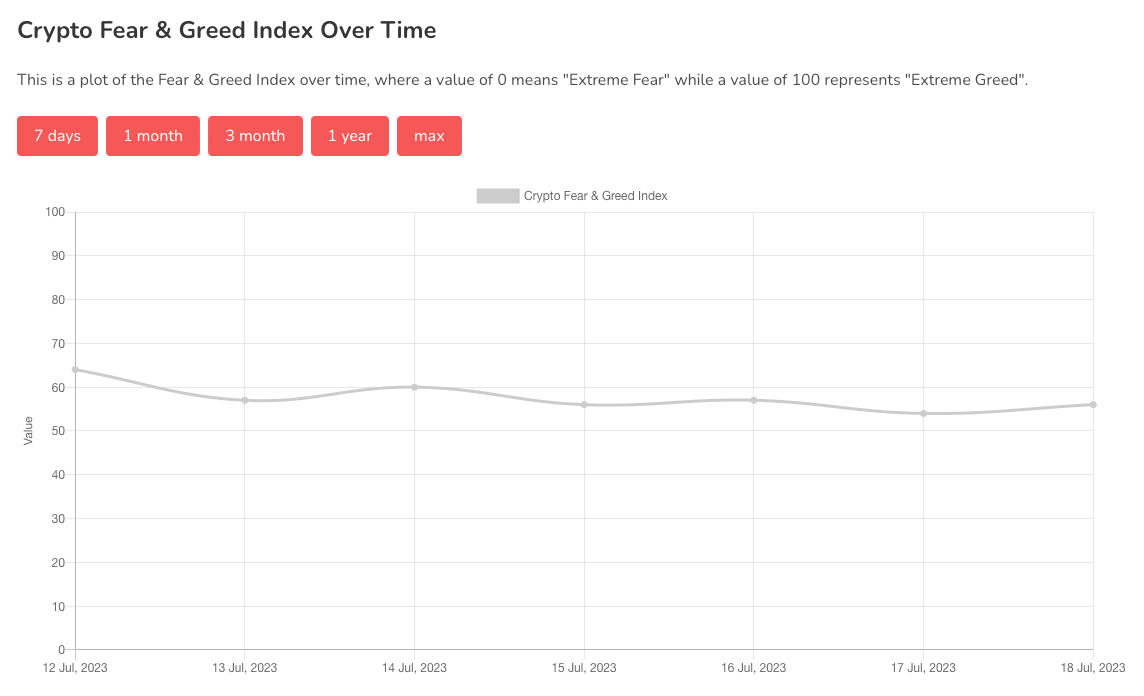
Chart #5 - Bitcoin Fear and Greed Index
The Bitcoin Fear and Greed Index is sitting at 56 today, indicating Greed.
The highest the index has been over the past seven days is 64, and the lowest is 54.
Banter’s Take
Most coins appear to be maintaining support and preparing for a slight bounce. The biggest risk, however, lies with BNB. If it sells off and dips below $225, it could potentially drag the entire crypto market down with it.
Stay safe my friends!
Go to our Crypto Banter Discord here where Sheldon and Kyle give updates on the charts and trades from The Daily Candle newsletter!