

📈📉 Time to LONG GLMR!
📈📉 Time to LONG GLMR!
PLUS: DXY Showing Signs of Bouncing!
Overview
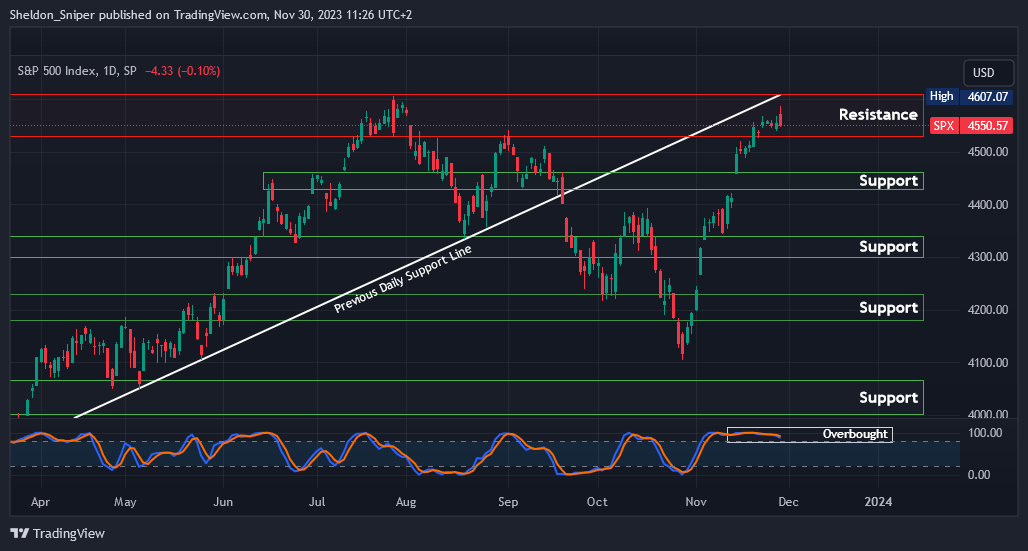
Chart #1 - S&P 500 (SPX) Daily
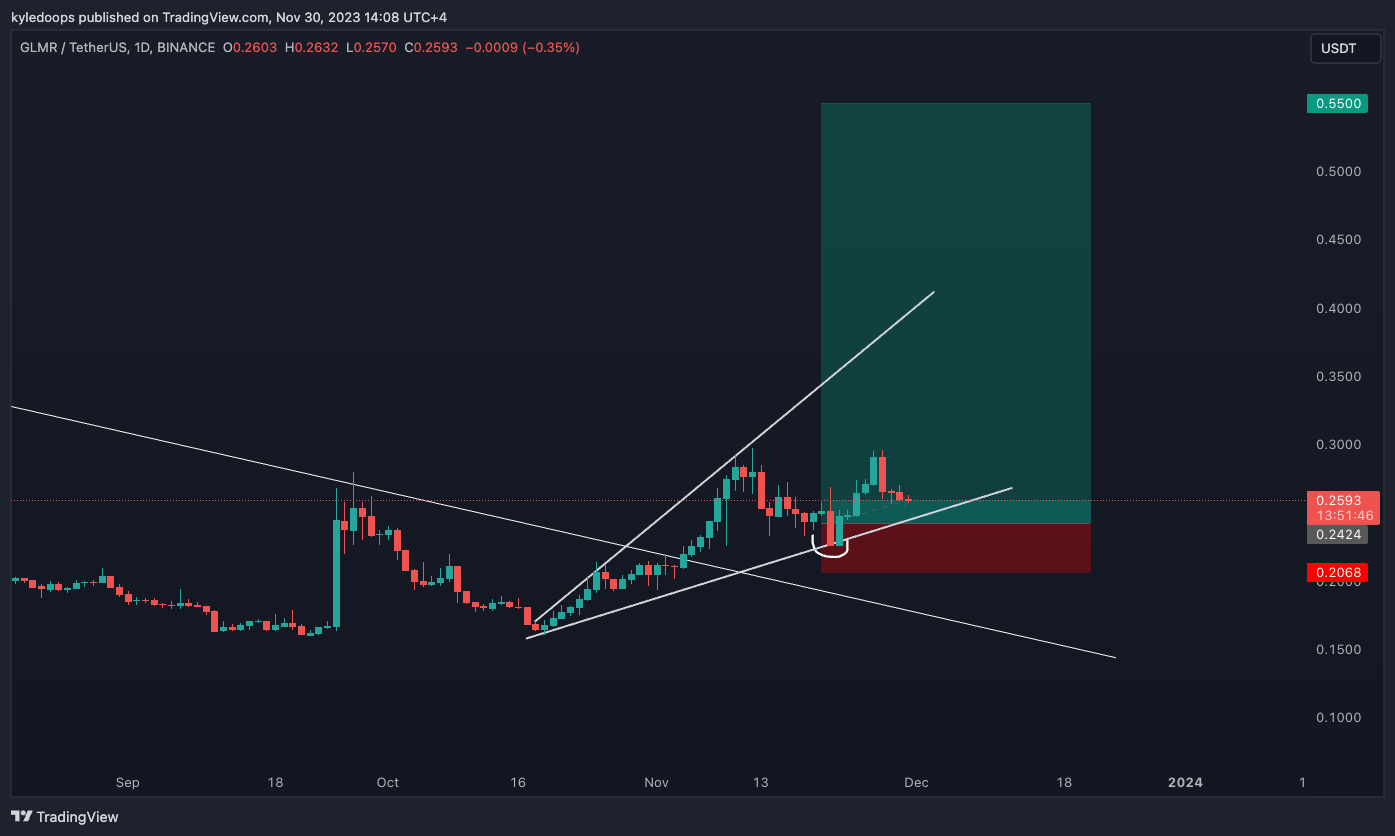
Chart #2 - Moonbeam (GLMRUSDT) Daily
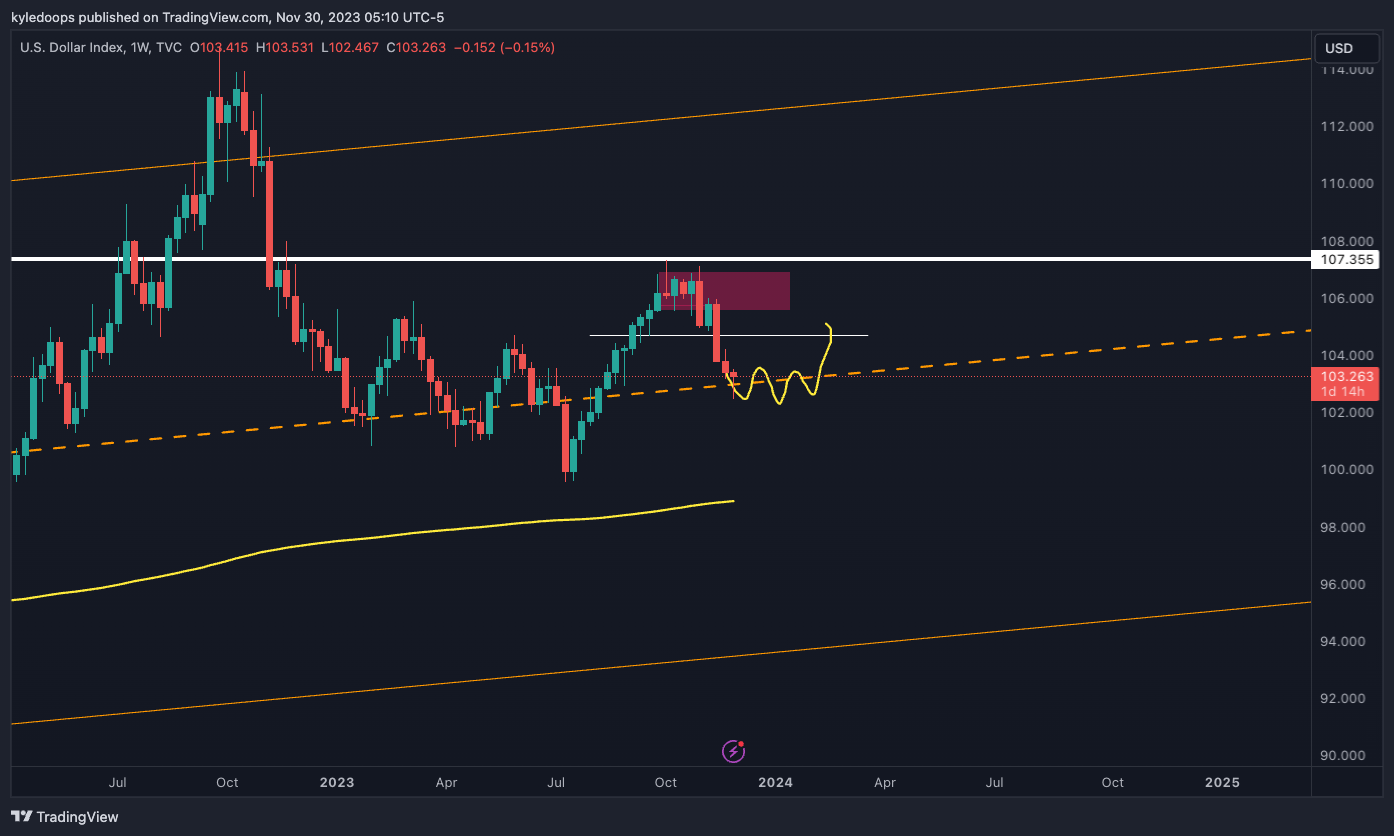
Chart #3 - U.S. Dollar (DXY) Weekly
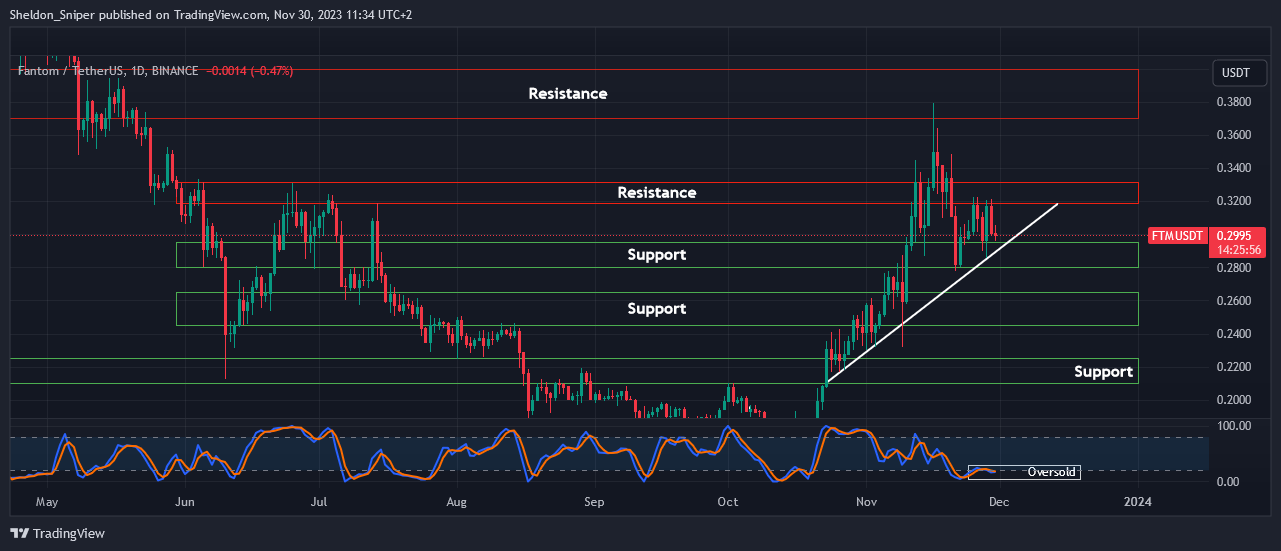
Chart #4 - Fantom (FTMUSDT) Daily
Chart #5 - Fear and Greed Index
Chart #1 - S&P 500 (SPX) Daily
Chartist: Sheldon
(For the chart screenshot, click here.)
The SPX is currently at 4,550, and overbought on the daily.
If it gets rejected here, there could be a retrace down to the next support at 4,430 - 4,460, or even the area of support below that at around 4,300 - 4,340.
Sign-up and trade on Bybit today.
Exclusive $30,000 deposit rewards and bonuses up for grabs!
Chart #2 - Moonbeam (GLMRUSDT) Daily
Chartist: Kyle
(For the chart screenshot, click here.)
GLMR is coming back down for what may be a bullish retest into its trend line.
I will be looking to build a long entry around $0.24. I will scale into the order right down towards the stop loss at $0.20.
This is a longer-term swing with a measured move up to $0.50.
Claim your Bitget sign-up bonuses here (details below).

Outsmart 99% Of The Market!
Get full access into our Discord And Telegram group, where you'll find all of our premium content!
👉 Trade Signals!
👉 Trade Set-Ups!
👉 Trading Challenges!
👉 Education!
👉 SO MUCH MORE!
Chart #3 - U.S. Dollar (DXY) Weekly
Chartist: Kyle
(For the chart screenshot, click here.)
The DXY is coming into a support zone and, as you can see, is already showing signs of bouncing.
The expectation would be that the dollar will oscillate around the dashed line representing the mid-level of the rising channel.
This will likely cause a new range to simultaneously form in both the stock market and crypto.
Claim your Bitget sign-up bonuses here (details below).
Chart #4 - Fantom (FTMUSDT) Daily
Chartist: Sheldon
(For the chart screenshot, click here.)
The $0.2950 level has been holding as support nicely.
FTM is completely oversold on the daily, so I’m looking at entering a long trade here, with a stop loss just below the bottom of the range support of $0.28.
My first target is for the price to once again test the $0.37 - $0.40 area of resistance, which is the same area where it got rejected around two weeks ago.
Targets after that are $0.45 - $0.52, followed by the $0.60 level of resistance.
Claim your Bitget sign-up bonuses here (details below).
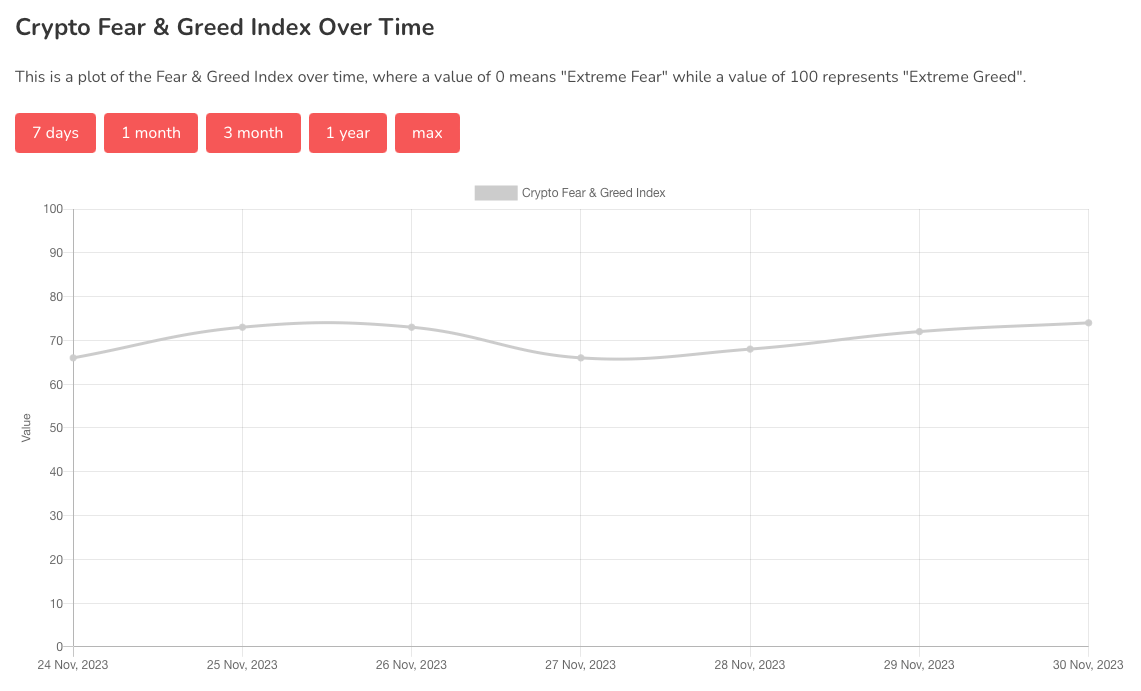
Chart #5 - Fear and Greed Index
The Fear and Greed Index is sitting at 74 today, indicating Greed.
The highest the index has been over the past seven days is 74, and the lowest is 66.
Banter’s Take
Bitcoin has been up for seven weeks in a row. We are closer to the end of this move than the beginning, which means soon we will need to start expecting a proper pullback.
The pullback level to watch for strong support is $32,000.
Stay safe my friends!
Go to our Crypto Banter Discord here where Sheldon and Kyle give updates on the charts and trades from The Daily Candle newsletter!