

📈📉 Time to Long Perpetual Protocol as Alts Skyrocket!
📈📉 Time to Long Perpetual Protocol as Alts Skyrocket!

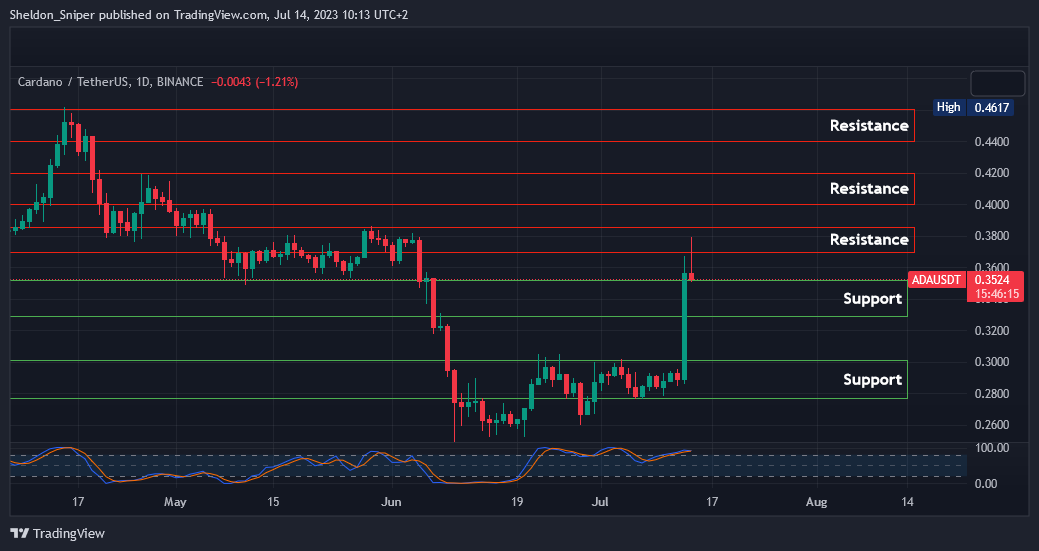
Chart #1 - Cardano (ADAUSDT) 1-Day Chart
Chartist: Sheldon
(For the chart screenshot, click here.)
Yesterday, we saw a massive rally in the market, notably in some altcoins, including ADA, which soared by nearly 30% on the day.
The price rose from $0.2860 all the way to $0.37, but it has since retraced and is currently trading at around $0.35. It's also worth noting that the price has now reached the $0.33 - $0.35 support zone.
I anticipate the price will stabilize within this support area, positioning it to ascend to $0.365 - $0.385, or even $0.40 - $0.42.
Bitcoin Dominance has begun to decline, so money is shifting from BTC to alts.
Sign-up and trade on Bybit today.
Exclusive $30,000 deposit rewards and bonuses up for grabs!
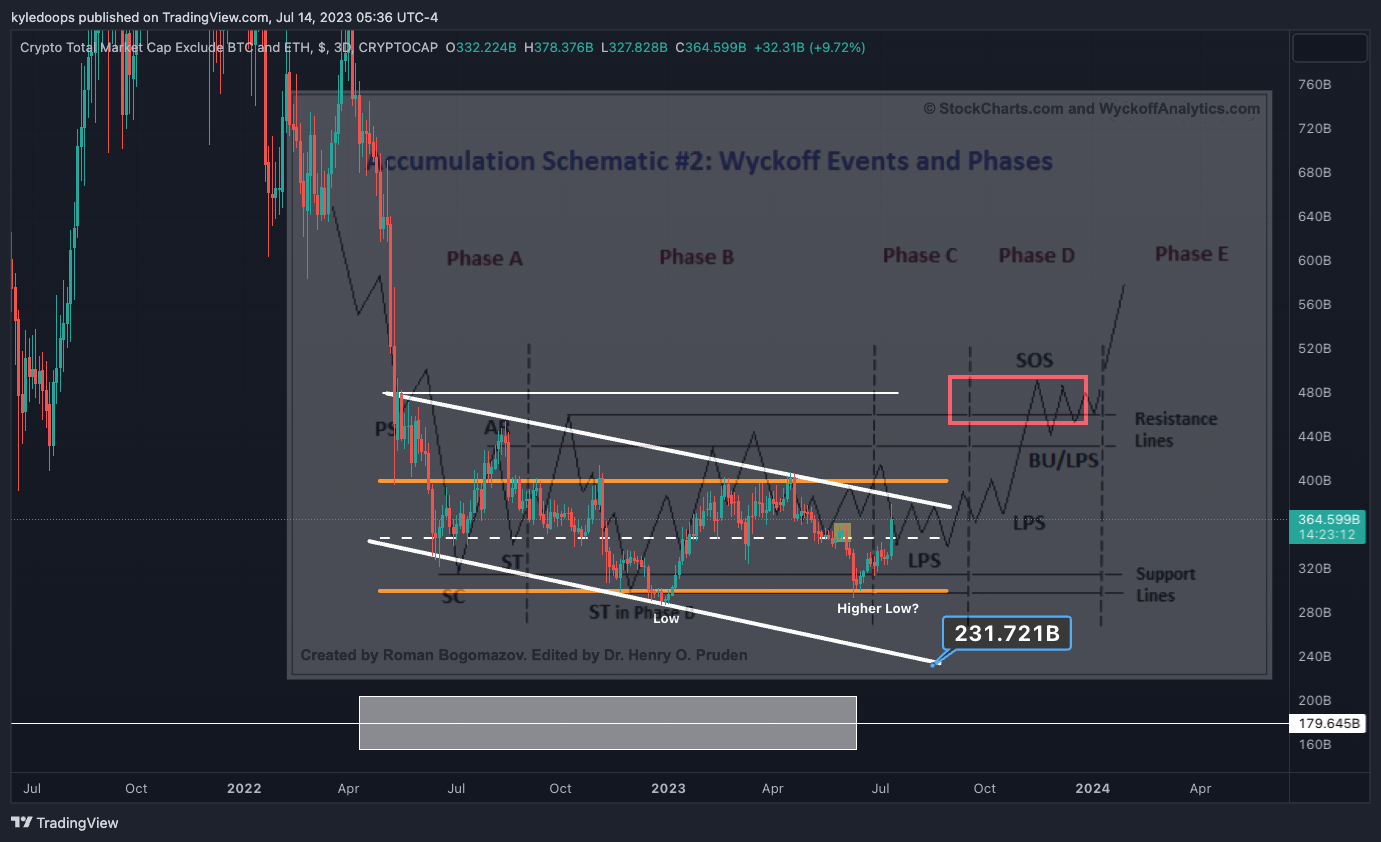
Chart #2 - TOTAL3 3-Day Chart
Chartist: Kyle
(For the chart screenshot, click here.)
The TOTAL3 appears to be in a Wyckoff Accumulation Schematic 2, indicating that it's currently consolidating in Phase C, the Last Point of Support (LPS) phase.
This LPS phase could potentially trigger a surge in the market cap, up to around $400 billion. Significant resistance exists at that level, and only once the price surpasses the $400 billion threshold will major resistance have been cleared.
Following this, anticipate the Sign of Strength (SOS) phase, indicative of robustness. Should consolidation occur at these levels, it implies that altcoins are likely to rally sharply against Bitcoin.
𝗣𝗿𝗶𝗺𝗲 𝗫𝗕𝗧
Sign up for a new Trading Account on Prime XBT!
Receive a deposit bonus of up to $7,000 with promo code: KyleDoops

Sign up for a new Trading Account on Prime XBT!
Receive a deposit bonus of up to $7,000 with promo code: SheldonSniper
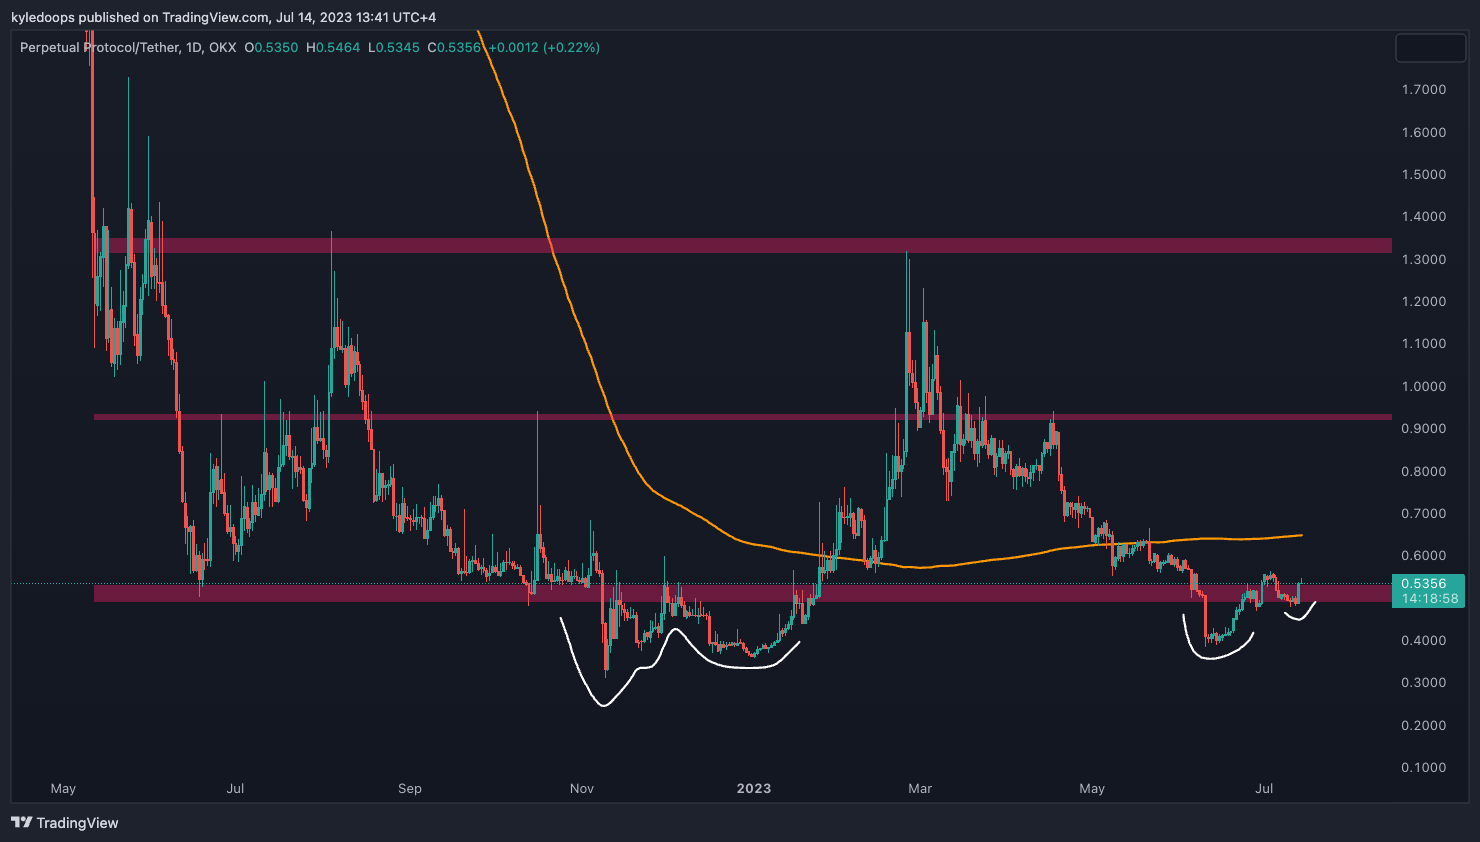
Chart #3 - Perpetual Protocol (PERPUSDT) 1-Day Chart
Chartist: Kyle
(For the chart screenshot, click here.)
Perpetual Protocol is reclaiming the range low, at $0.5358.
When considering a long position on this, our stop loss would be set below yesterday's low.
As long as that level holds, a break back into the range likely pushes prices towards the mid-range, around $0.90.
Claim your Bitget sign-up bonuses here (details below).
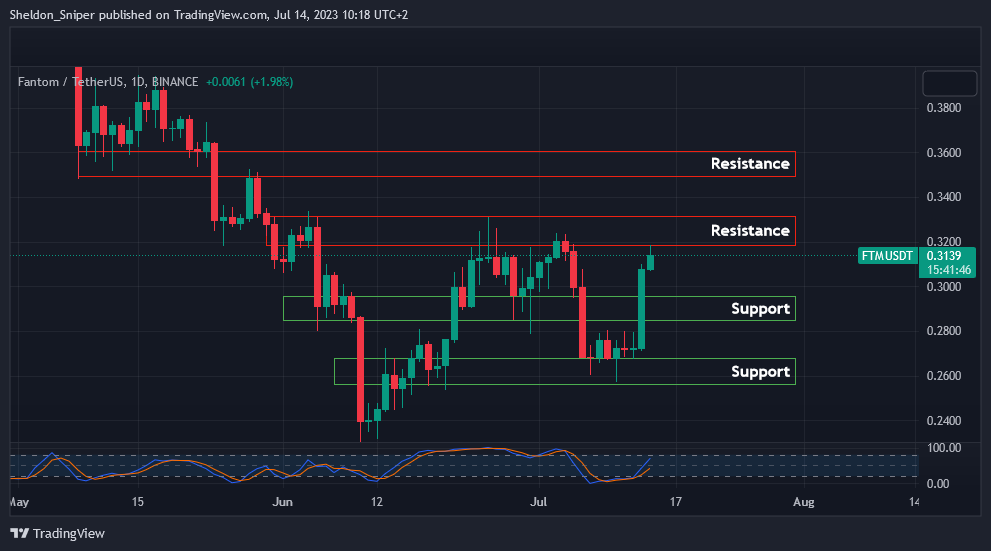
Chart #4 - Fantom (FTMUSDT) 1-Day Chart
Chartist: Sheldon
(For the chart screenshot, click here.)
FTM has rallied 17% in the past day, from $0.2720 to $0.32, where it has encountered the $0.32 - $0.335 resistance zone.
I anticipate the price will now stabilize in this area, or even potentially decline to test the next support zone at $0.285 - $0.295. This could position the price to revisit the $0.32 - $0.335 resistance area, and perhaps even challenge the next resistance at $0.35 - $0.36.
If altcoins continue rallying over the next few weeks, I see substantial upside for FTM.
Claim your Bitget sign-up bonuses here (details below).
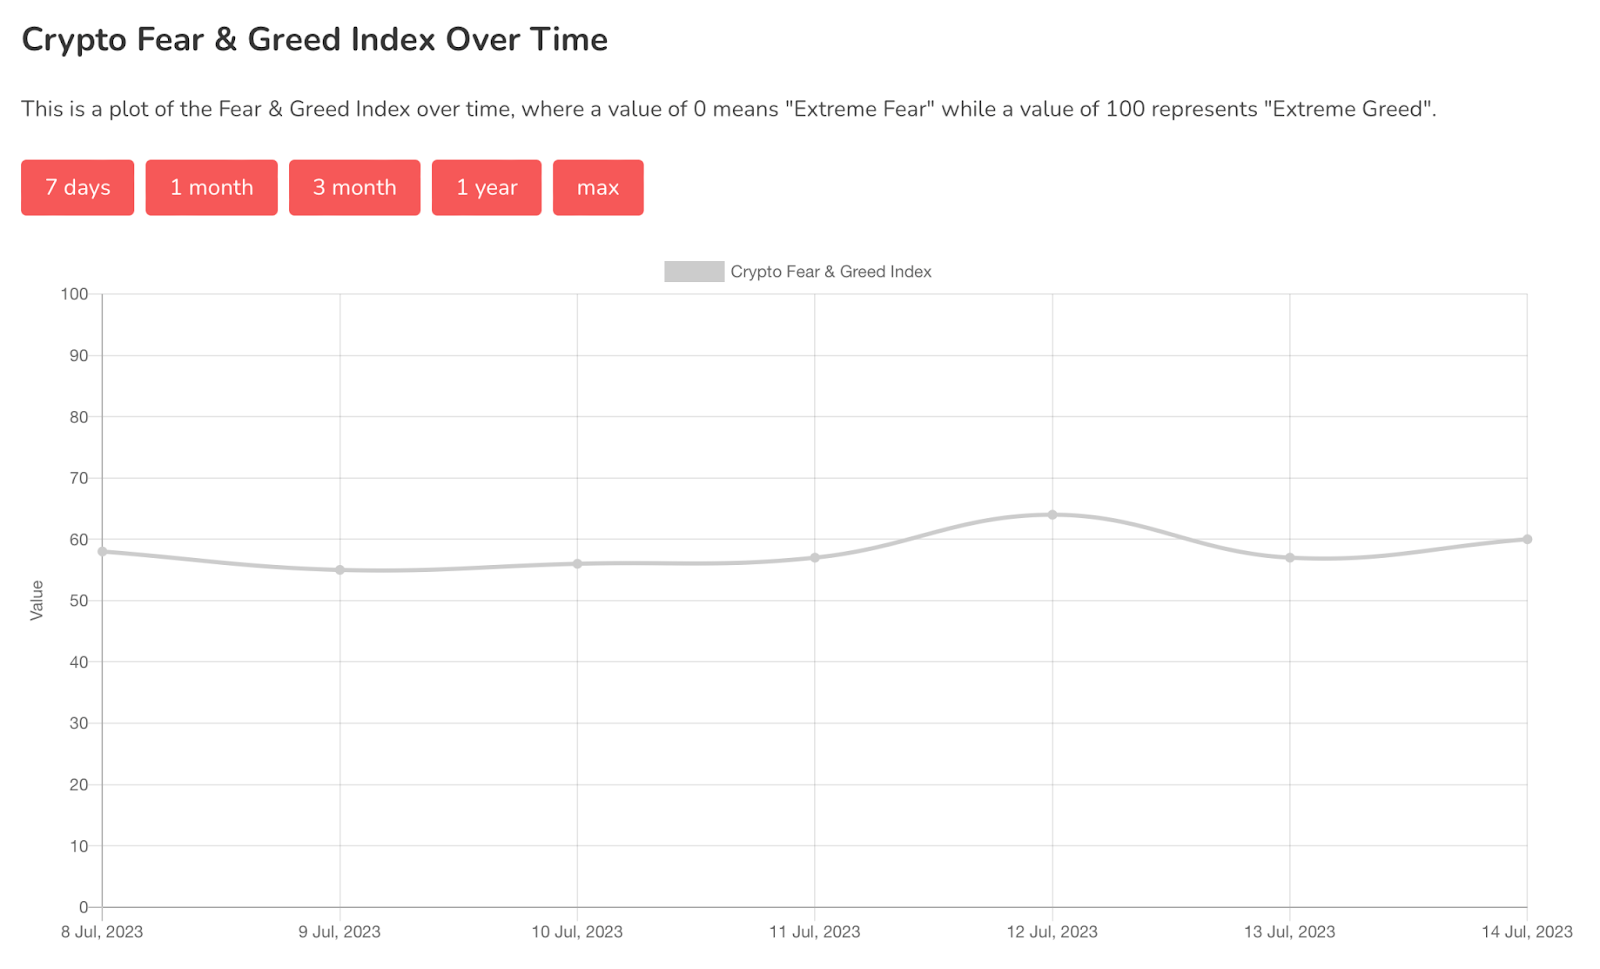
Chart #5 - Bitcoin Fear and Greed Index
The Bitcoin Fear and Greed Index is sitting at 60 today, indicating Greed.
The highest the index has been over the past seven days is 64, and the lowest is 55.
Banter’s Take
The XRP case triggered a substantial 100% price movement in less than 24 hours, reintroducing risk appetite into alts. The surge might be sufficient to stimulate the entire market. What's crucial is maintaining sustained momentum, as a stall could cause late longs to exit, potentially leading to a cascading effect.
Stay safe my friends!
Go to our Crypto Banter Discord here where Sheldon and Kyle give updates on the charts and trades from The Daily Candle newsletter!