

📈📉 Time to SHORT BNB! (Trade Setup)
📈📉 Time to SHORT BNB! (Trade Setup)
PLUS: RUNE Looking Bullish?
Overview
Chart #1 - Bitcoin (BTCUSDT) Daily
Chart #2 - BNB (BNBUSDT) Daily
Chart #3 - USDT Market Cap (USDT) 4-Hour
Chart #4 - THORChain (RUNEUSDT) 12-Hour
Chart #5 - Fear and Greed Index
Chart #1 - Bitcoin (BTCUSDT) Daily
Chartist: Sheldon
(For the chart screenshot, click here.)
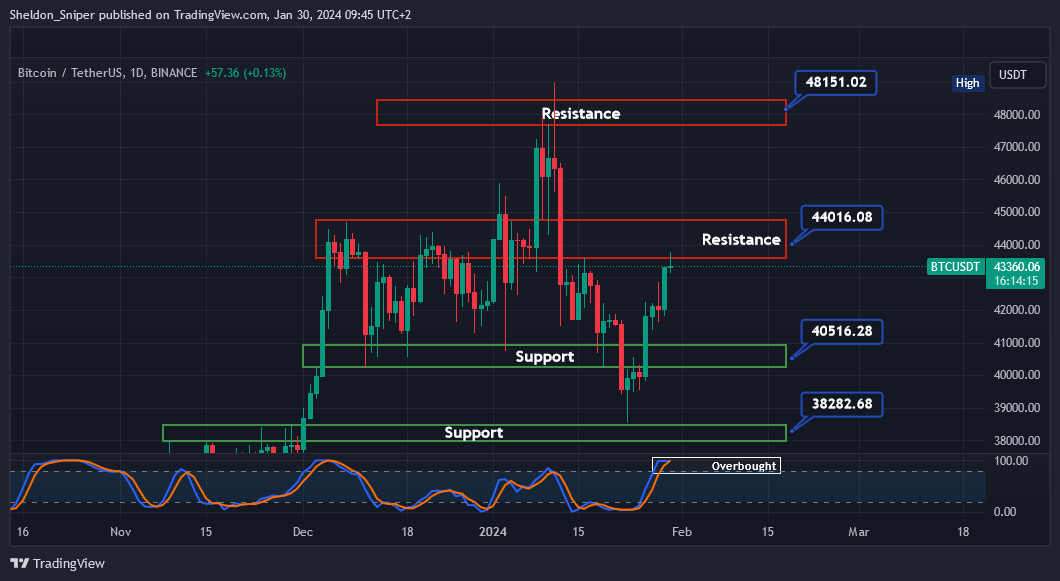
The price of Bitcoin is currently testing $43,500, the bottom of the resistance range.
With the price being close to overbought on the daily timeframe, I anticipate the $43,500 - $44,850 area will be very tough to break during the first attempt.
If the price gets rejected and reverses its trend back to the downside, the next area of support is at $40,300 - $41,000.
Sign-up and trade on Bybit today.
Exclusive $30,000 deposit rewards and bonuses up for grabs!
Chart #2 - BNB (BNBUSDT) Daily
Chartist: Kyle
(For the chart screenshot, click here.)
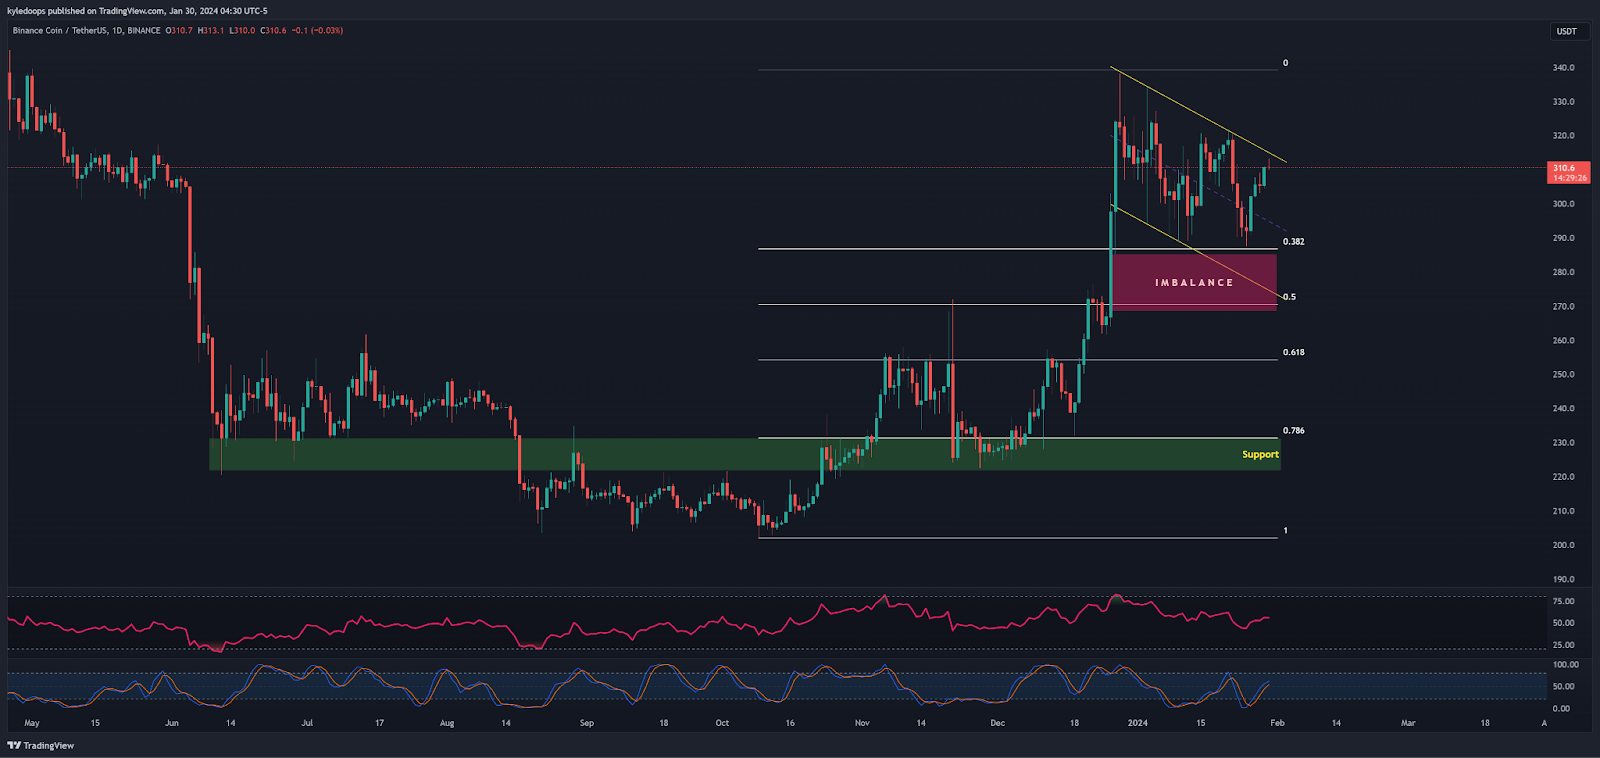
BNB has once again reached the top of our descending channel, presenting a short-term short opportunity.
Currently, it's trading around the $310 region, with the first Point of Interest (PoI) at $296.5.
If it falls further to $287.5, we may target the imbalance zone with two possible bounce areas at $276.5 and $268.2.
The invalidation level is at $327.3.
Claim your Bitget sign-up bonuses here (details below).

Outsmart 99% Of The Market!
Get full access into our Discord And Telegram group, where you'll find all of our premium content!
👉 Trade Signals!
👉 Trade Set-Ups!
👉 Trading Challenges!
👉 Education!
👉 SO MUCH MORE!
Chart #3 - USDT Market Cap (USDT) 4-Hour
Chartist: Kyle
(For the chart screenshot, click here.)
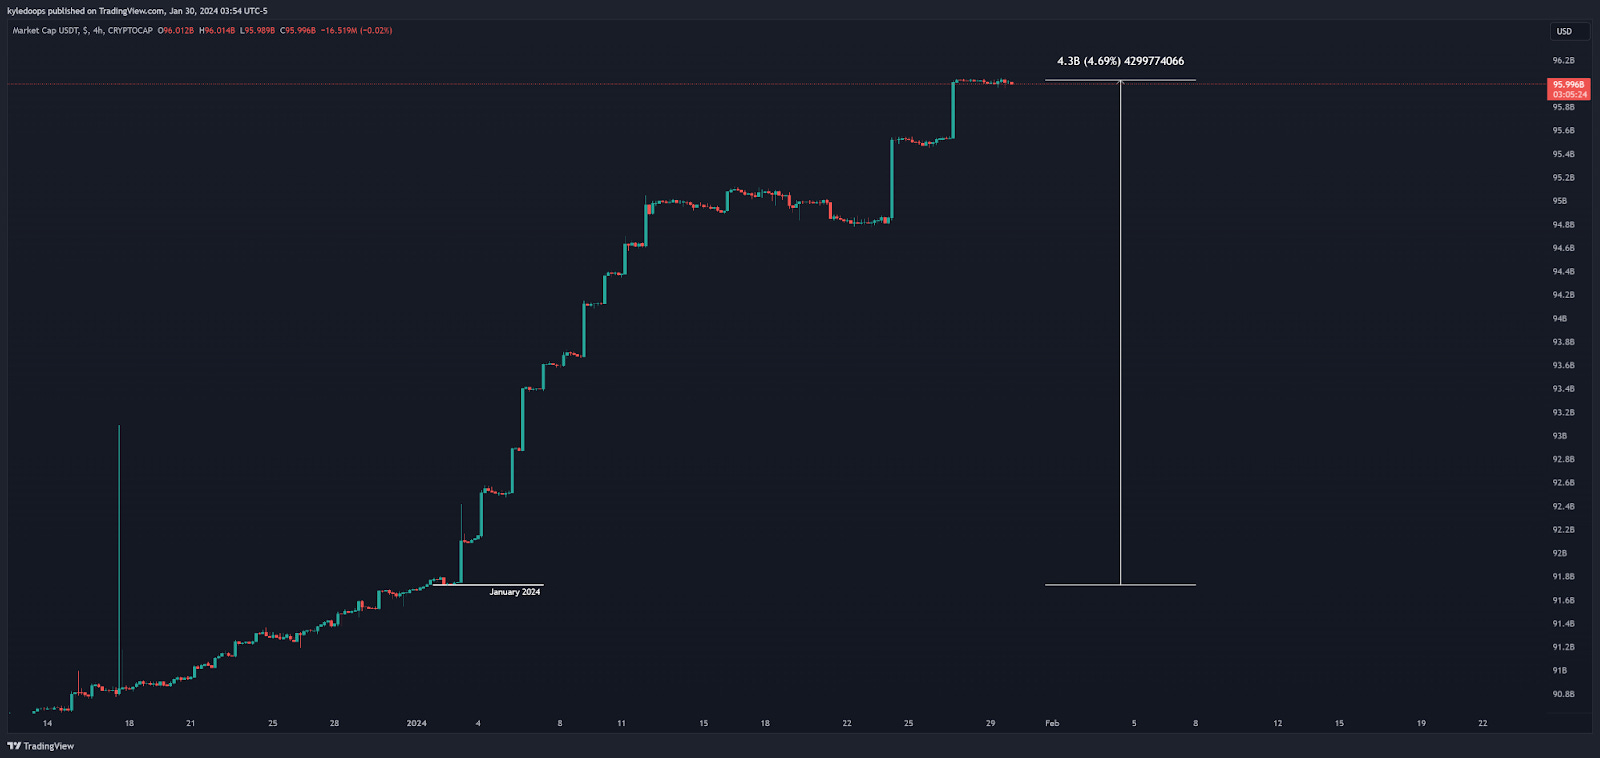
Tether's market cap has increased by 4.7% in 2024, which is $4.3 billion - lots of fresh inflowing capital!
Another observation is that spikes consistently occur during the New York sessions, always at the same time at 07:00 NY Local Time.
In the last two days alone, it was just above $1 billion. One thing is certain: in 2024, the crypto market appears poised to rise to new levels!
Claim your Bitget sign-up bonuses here (details below).
Chart #4 - THORChain (RUNEUSDT) 12-Hour
Chartist: Sheldon
(For the chart screenshot, click here.)
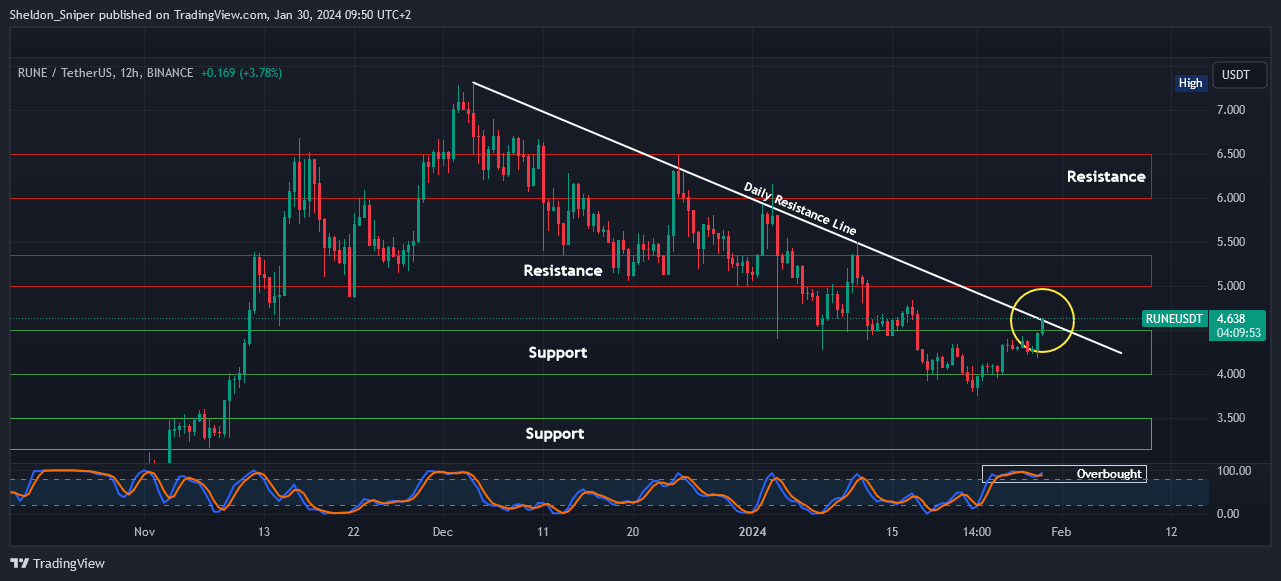
RUNE is trying to break through its daily resistance trend line (from the beginning of December).
Price is overbought on the 12HR chart, but if this current $4.60 - $4.70 level can be broken on higher time frames, it may test the next resistance at $5.00 – $5.40.
I would only consider entering a trade once the daily resistance line is broken, and the price of RUNE comes down to retest the $4.50 level of support.
RUNE has been performing well over the last few weeks, and I believe there is more potential in the coming weeks.
Claim your Bitget sign-up bonuses here (details below).
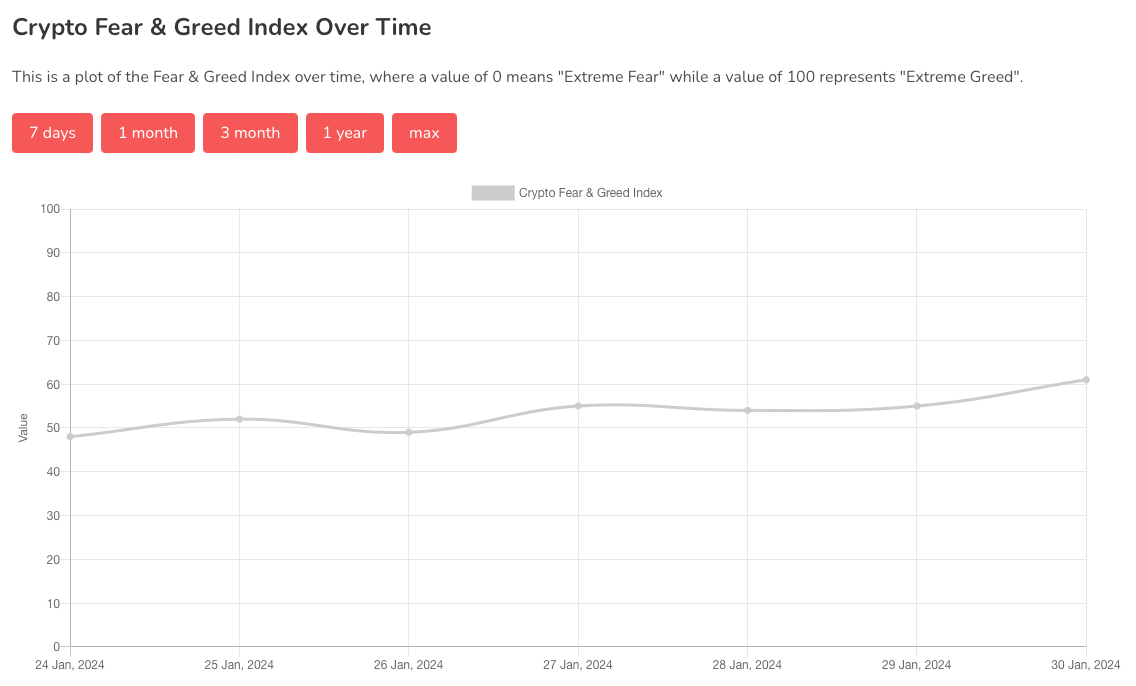
Chart #5 - Fear and Greed Index
The Fear and Greed Index is sitting at 61 today, indicating Greed.
The highest the index has been over the past seven days is 61, and the lowest is 48.
Banter’s Take
Bitcoin is targeting the $44,300 area and may retest $43,250 today.
If that holds, it may slowly aim for the top of the range ($40,000 - $44,400). There is a possibility that within the US session today, the DXY drops and targets to fill the gap at 102.742 - 102.609.
In general, the bears are not showing a strong presence yet.
Stay safe my friends!
Go to our Crypto Banter Discord here where Sheldon and Kyle give updates on the charts and trades from The Daily Candle newsletter!