

📈📉 Time to SHORT Gold and LONG the Dow!
📈📉 Time to SHORT Gold and LONG the Dow!

Overview
Chart #1 - Fantom (FTMUSDT) Daily Chart
Chart #2 - Gold (XAUUSD) Daily Chart
Chart #3 - US Wall St 30 (US30USD) Daily Chart
Chart #4 - Ethereum (ETHUSDT) Daily Chart
Chart #5 - Fear and Greed Index

Chart #1 - Fantom (FTMUSDT) Daily Chart
Chartist: Sheldon

(For the chart screenshot, click here.)
On Thursday, the price of FTM faced rejection around the $0.21 mark and has since begun retracing downwards. Currently, it's trading at $0.1980. With the next support level still 7% away, the bulls have their work cut out for them to prevent the price from reaching the next support zone of $0.1650 - $0.1850.
If the bulls manage to intervene here, there's a potential for the price to retest the resistance area between $0.21 and $0.23. A break through this resistance would place the next target resistance between $0.25 - $0.2650.
FTM's price has been under sustained pressure over the last 6-8 weeks. Being significantly oversold, I anticipate a potential relief bounce, especially if BTC swings up.
𝗣𝗿𝗶𝗺𝗲 𝗫𝗕𝗧
Sign up for a new Trading Account on Prime XBT!
Receive a deposit bonus of up to $7,000 with promo code: SheldonSniper
Sign-up and trade on Bybit today.
Exclusive $30,000 deposit rewards and bonuses up for grabs!
Chart #2 - Gold (XAUUSD) Daily Chart
Chartist: Kyle
(For the chart screenshot, click here.)
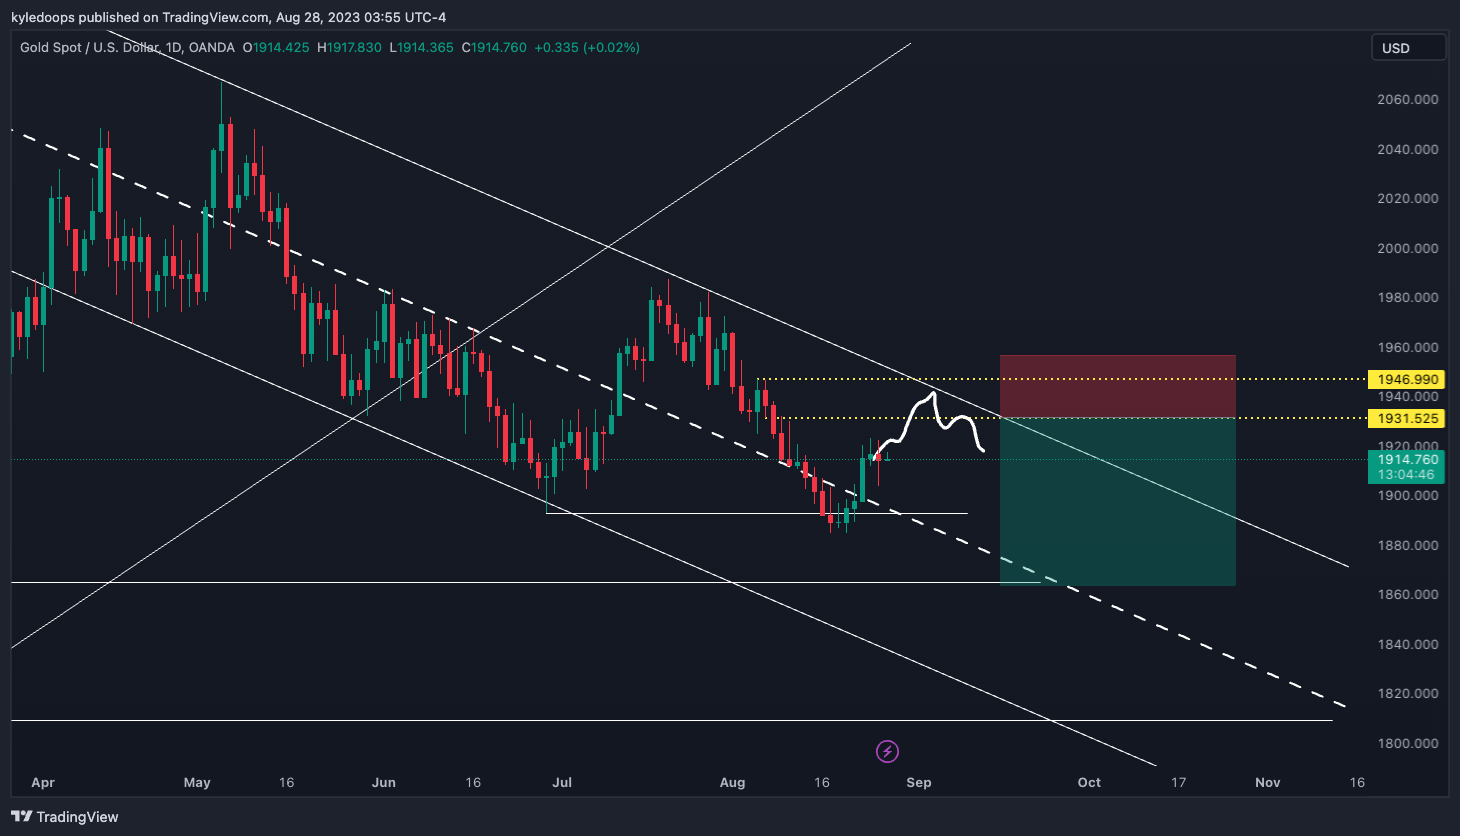
Time to go short on Gold!
The price is in a downward-sloping channel. I'm building a short position between $1,931 - $1,946.
My stop is at $1,957, and my take profit is at $1,860.
𝗣𝗿𝗶𝗺𝗲 𝗫𝗕𝗧
Sign up for a new Trading Account on Prime XBT!
Receive a deposit bonus of up to $7,000 with promo code: KyleDoops
Chart #3 - US Wall St 30 (US30USD) Daily Chart
Chartist: Kyle
(For the chart screenshot, click here.)
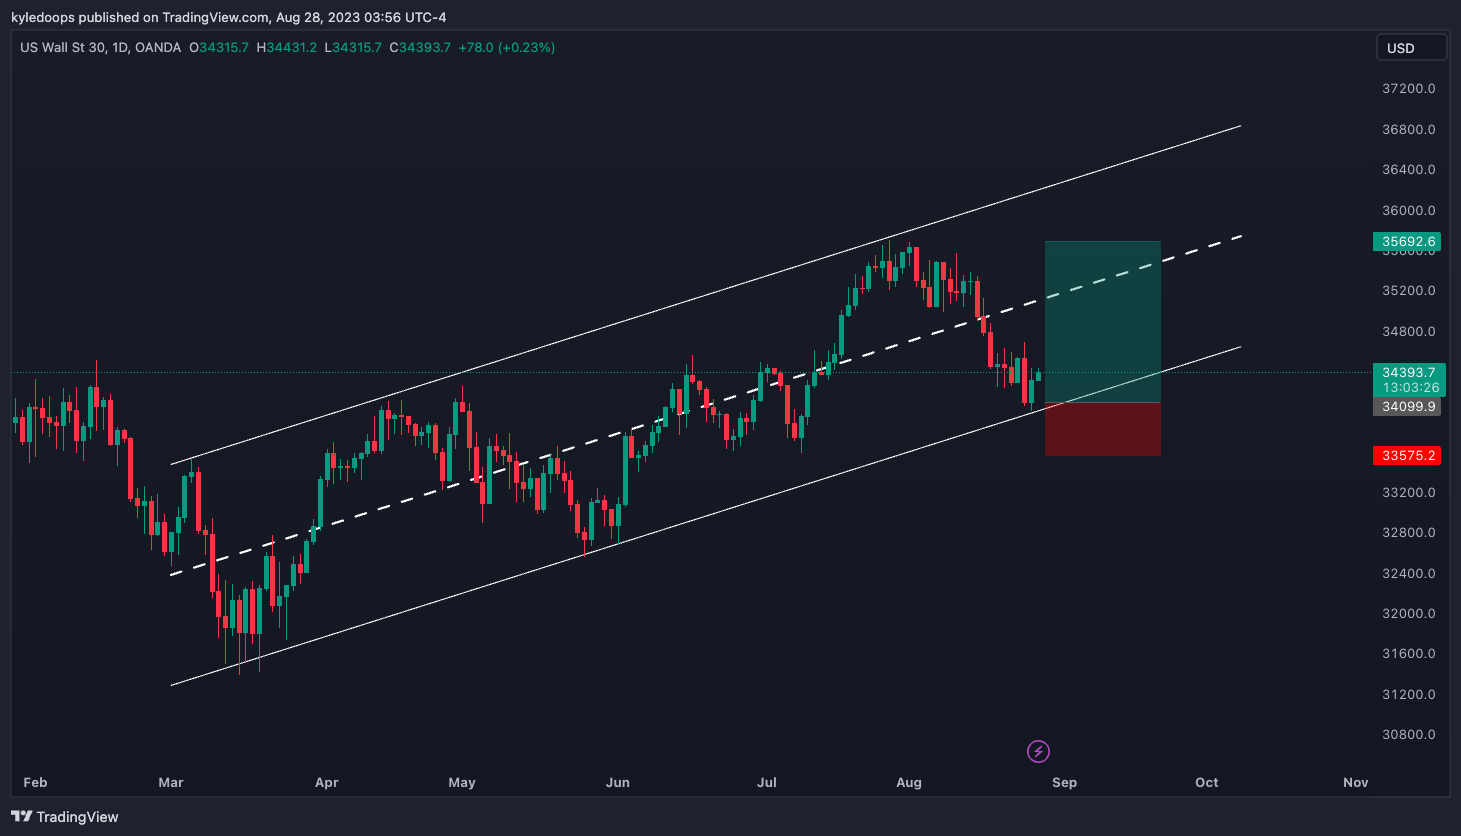
Price is in a rising channel. The entry is somewhat late, but I'm considering going long if the price returns to the entry at $34,097.
I’ll set my stop at $33,575 and take profit at $35,692, which is just shy of the range high.
Claim your Bitget sign-up bonuses here (details below).
Chart #4 - Ethereum (ETHUSDT) Daily Chart
Chartist: Sheldon

(For the chart screenshot, click here.)
ETH has hovered around the $1,650 support level for the past 10 days, and there's little indication of the bulls stepping in to drive the price upward.
If this level gives way, the next support is at $1,550, followed by a zone between $1,450 - $1,500. On the bullish side, if momentum shifts, the immediate resistance lies at the $1,700 range high. Breaking that could lead to the next resistance zone of $1,800 - $1,850.
Claim your Bitget sign-up bonuses here (details below).
Chart #5 - Fear and Greed Index
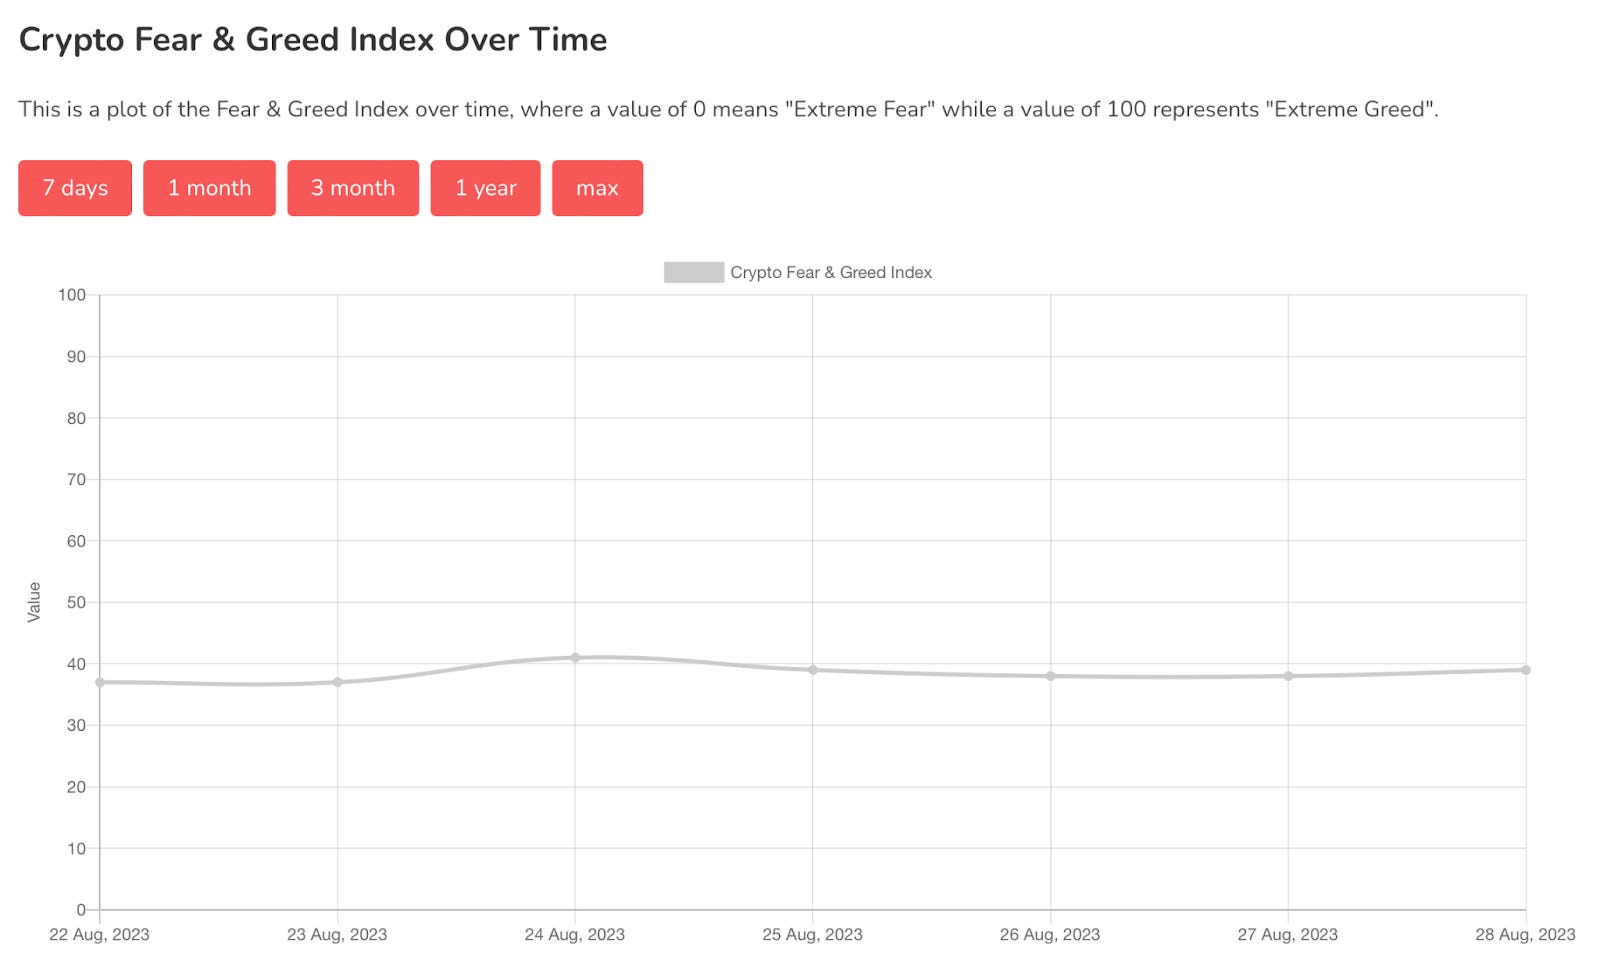
The Fear and Greed Index is sitting at 39 today, indicating Fear.
The highest the index has been over the past seven days is 41, and the lowest is 37.
Banter’s Take
The last glimmer of hope for the crypto markets hinges on the DXY selling off from its current mid-range position, coupled with a stock market bounce from support, with Bitcoin following suit. However, as long as the price remains below the 21 EMA, the risk leans to the downside.
Stay safe my friends!
Go to our Crypto Banter Discord here where Sheldon and Kyle give updates on the charts and trades from The Daily Candle newsletter!