

📈📉 Time to Short MATIC and SOL as Celsius Announces Sell-Off?
📈📉 Time to Short MATIC and SOL as Celsius Announces Sell-Off?

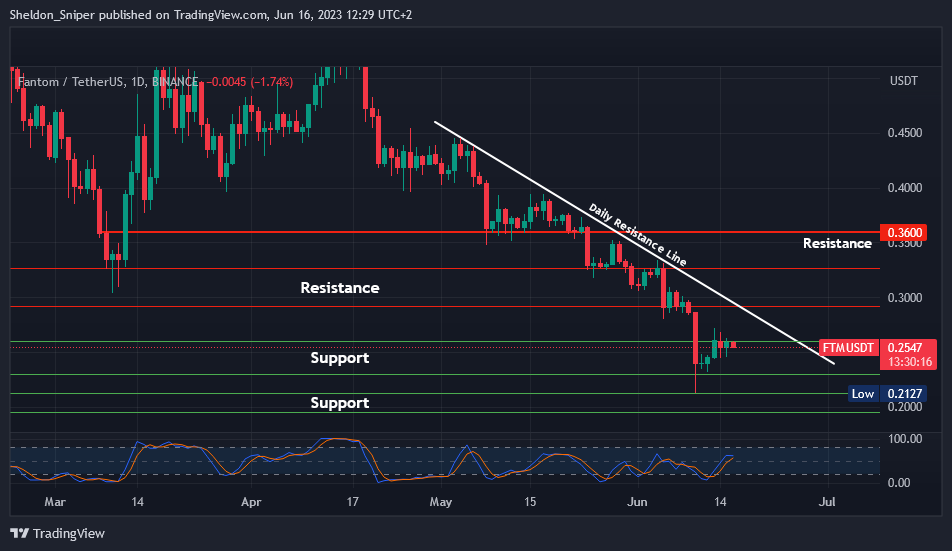
Chart #1 - Fantom (FTMUSDT) 1-Day Chart
Chartist: Sheldon
(For the chart screenshot, click here.)
This week, we saw the price of FTM dip to test the major support area of $0.1950 - $0.2125, where it reversed with an oversold bounce.
The price is currently consolidating between $0.2350 - $0.2550. If it can break through the top of its support range at $0.2550, it will then test the daily descending resistance line at $0.2750.
Beyond that, the next major resistance lies around the $0.2950 - $0.3300 range. There is a lot of fear right now in the market, and we are trading level by level, in very short-term trades.
Sign-up and trade on Bybit today.
Exclusive $30,000 deposit rewards and bonuses up for grabs!
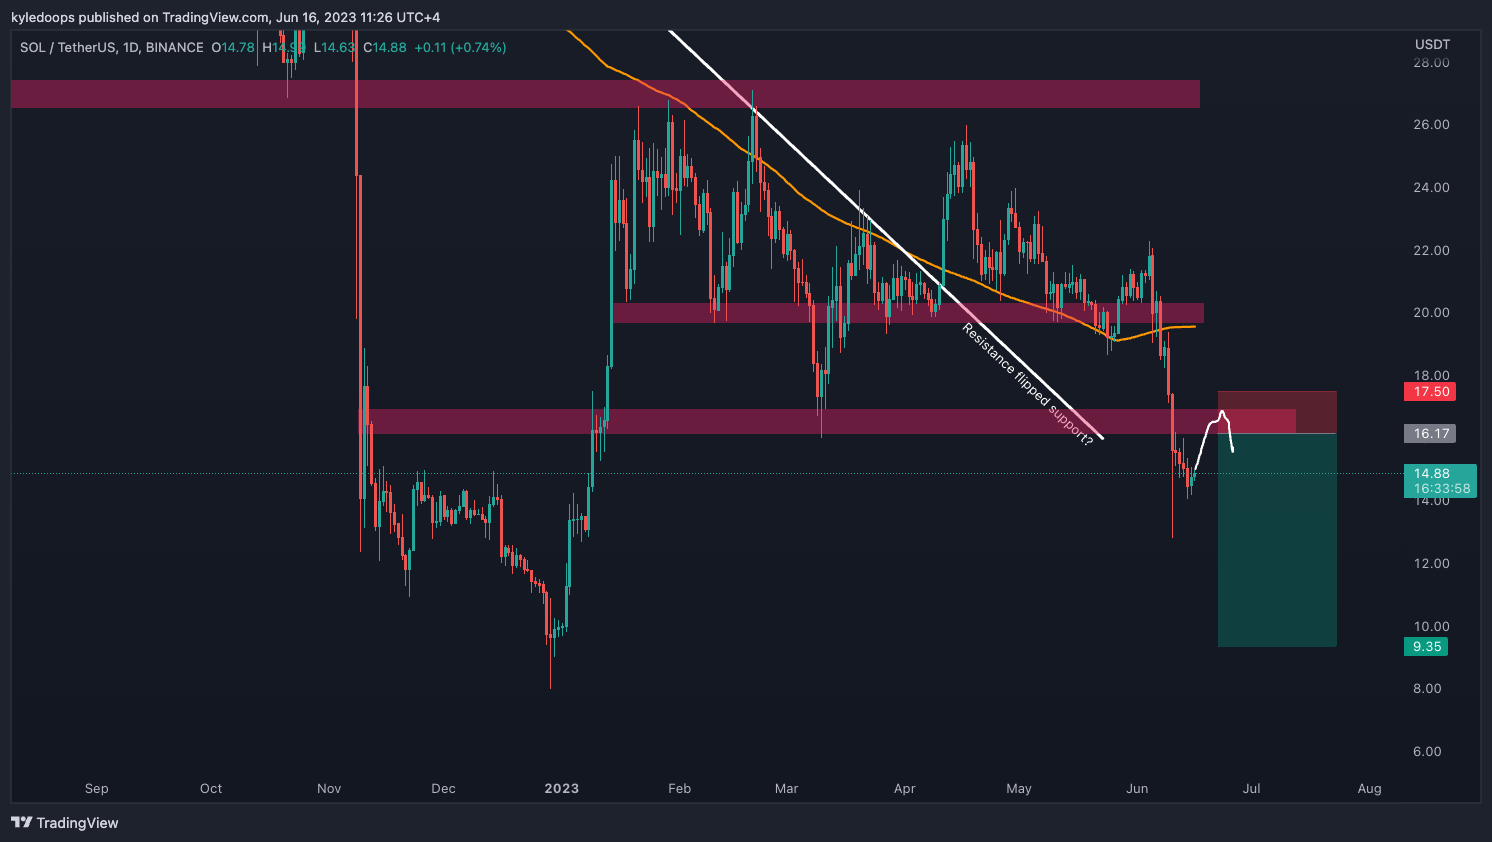
Chart #2 - Solana (SOLUSDT) 1-Day Chart
Chartist: Kyle
(For the chart screenshot, click here.)
Celsius is set to liquidate assets, and SOL is one of them.
Since the price has already fallen below its range low, a rise back to the range low that flips it from support and into resistance will present a nice short trade opportunity.
The first take profit target would be $13.09, with the final take profit target set at $9.35. The stop loss would be set at $17.50.
𝗣𝗿𝗶𝗺𝗲 𝗫𝗕𝗧
Sign up for a new Trading Account on Prime XBT!
Receive a deposit bonus of up to $7,000 with promo code: KyleDoops

Sign up for a new Trading Account on Prime XBT!
Receive a deposit bonus of up to $7,000 with promo code: SheldonSniper
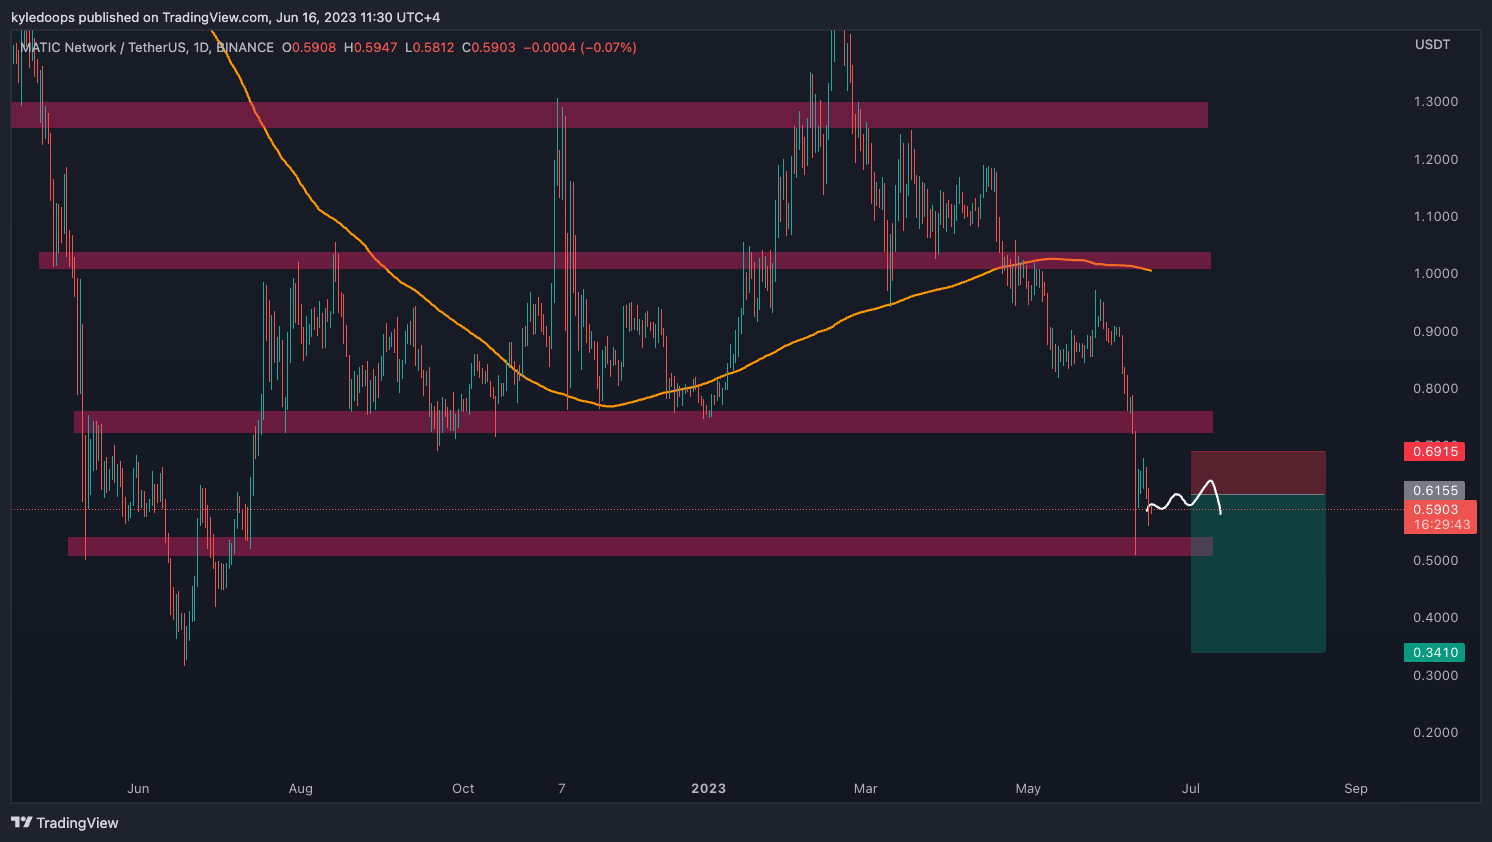
Chart #3 - Polygon (MATICUSDT) 1-Day Chart
Chartist: Kyle
(For the chart screenshot, click here.)
Celsius also plans to sell MATIC, which is also being delisted from exchanges as it was identified as a security by the SEC.
This will create selling pressure. So we can short MATIC too.
The entry point would be at $0.6155, with a stop loss at $0.6915, and our take profit target set at $0.3410.
Celsius is scheduled to begin selling their alts for BTC and ETH starting from July 1, 2023. If you don’t know why, get the full scoop in today’s Good Morning Crypto newsletter, and be sure to subscribe to it, as the news always affects the charts! So be ahead of it all!
Claim your Bitget sign-up bonuses here (details below).
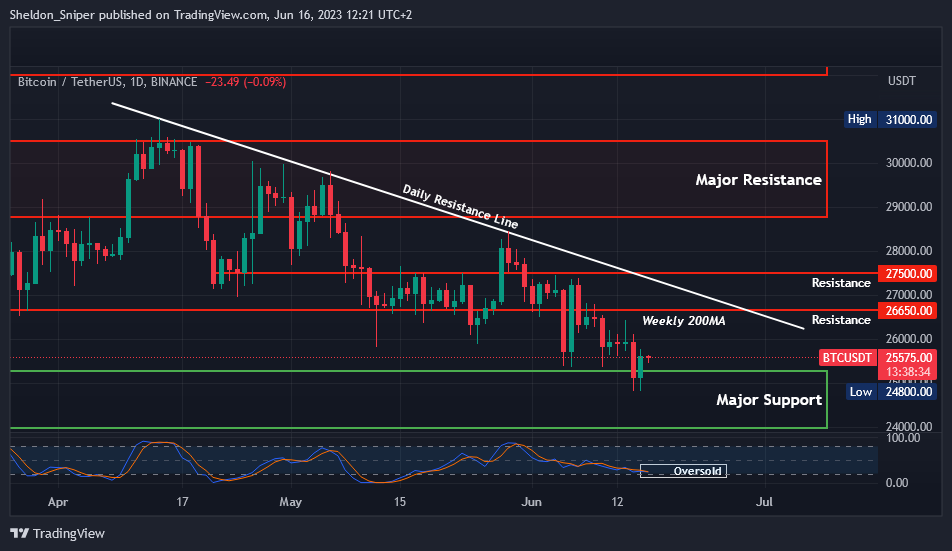
Chart #4 - Bitcoin (BTCUSDT) 1-Day Chart
Chartist: Sheldon
(For the chart screenshot, click here.)
Yesterday, we saw BTC positively reacting off the $24,800 support area.
Since the price is oversold on higher time frames, there could be an oversold bounce, causing the price to test the next area of resistance near the weekly 200MA, the daily descending resistance line, and the $26,650 - $27,000 resistance area, which all converge in the same zone.
But as we move into the weekend, BTC might continue to consolidate between $24,000 - $25,300 before we potentially see a significant move sometime next week.
Claim your Bitget sign-up bonuses here (details below).
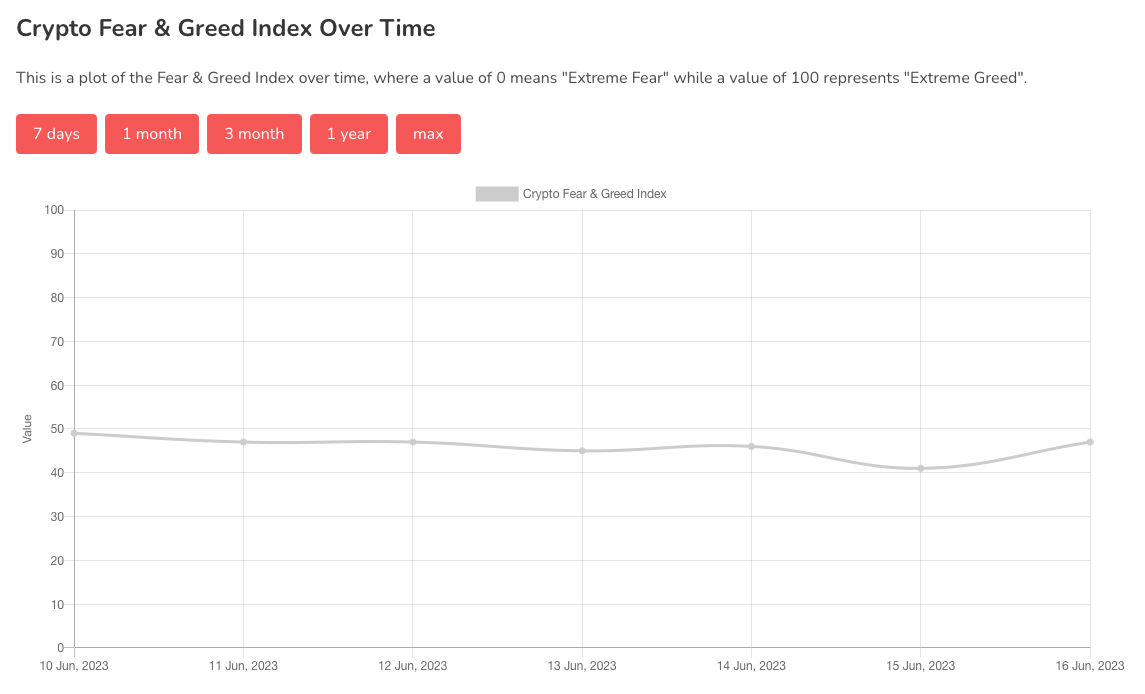
Chart #5 - Bitcoin Fear and Greed Index
The Bitcoin Fear and Greed Index is sitting at 47 today, Neutral.
The highest the index has been over the past seven days is 49, and the lowest is 41.
Banter’s Take
Short-sellers have been closing their in-the-money positions, which has led to a short-term price bounce. However, not all shorts have been fully closed out, so bitcoin’s price could squeeze a bit higher. But once it hits major resistance, it's time to tread carefully as most of these short traders are likely to open new positions.
Stay safe my friends!
Go to our Crypto Banter Discord here where Sheldon and Kyle give updates on the charts and trades from The Daily Candle newsletter!