

📈📉 Time to Trade Arweave and Algorand!
📈📉 Time to Trade Arweave and Algorand!

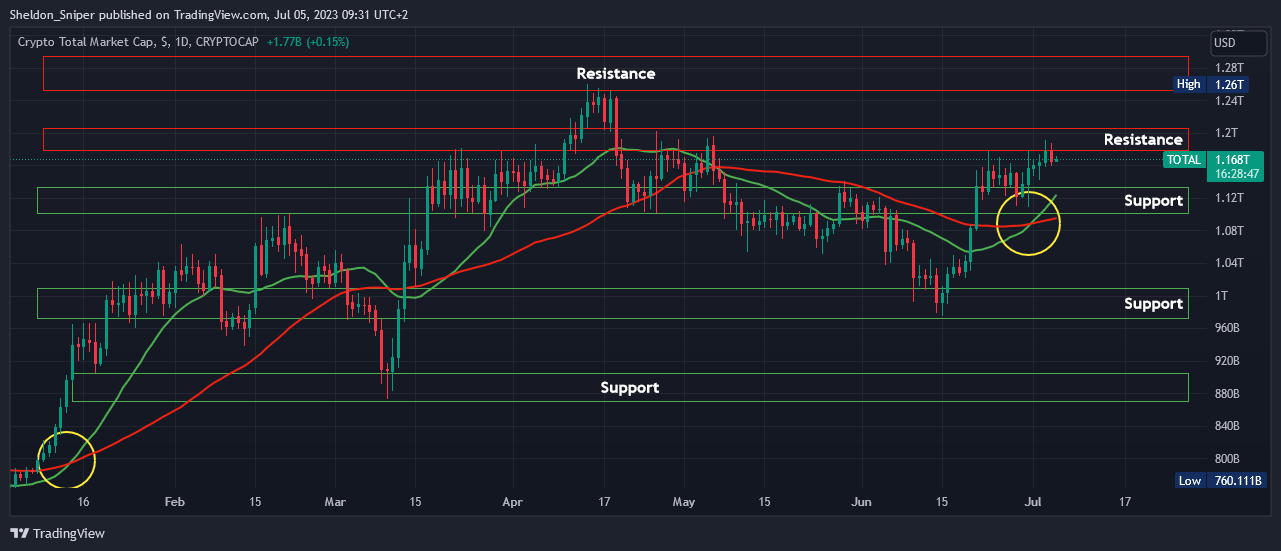
Chart #1 - TOTAL 1-Day Chart
Chartist: Sheldon
(For the chart screenshot, click here.)
A very bullish sign on the TOTAL chart is the recent cross of the daily 20 Moving Average and 50 Moving Average, a strong bullish signal.
The last time these averages crossed was in mid-January this year, when the TOTAL rallied for three straight months, going from $760B up to $1.26T.
So, it looks like the TOTAL is once again getting ready to rally. If it can break through $1.18T - $1.2T, it should head to $1.26T - $1.285T.
Sign-up and trade on Bybit today.
Exclusive $30,000 deposit rewards and bonuses up for grabs!
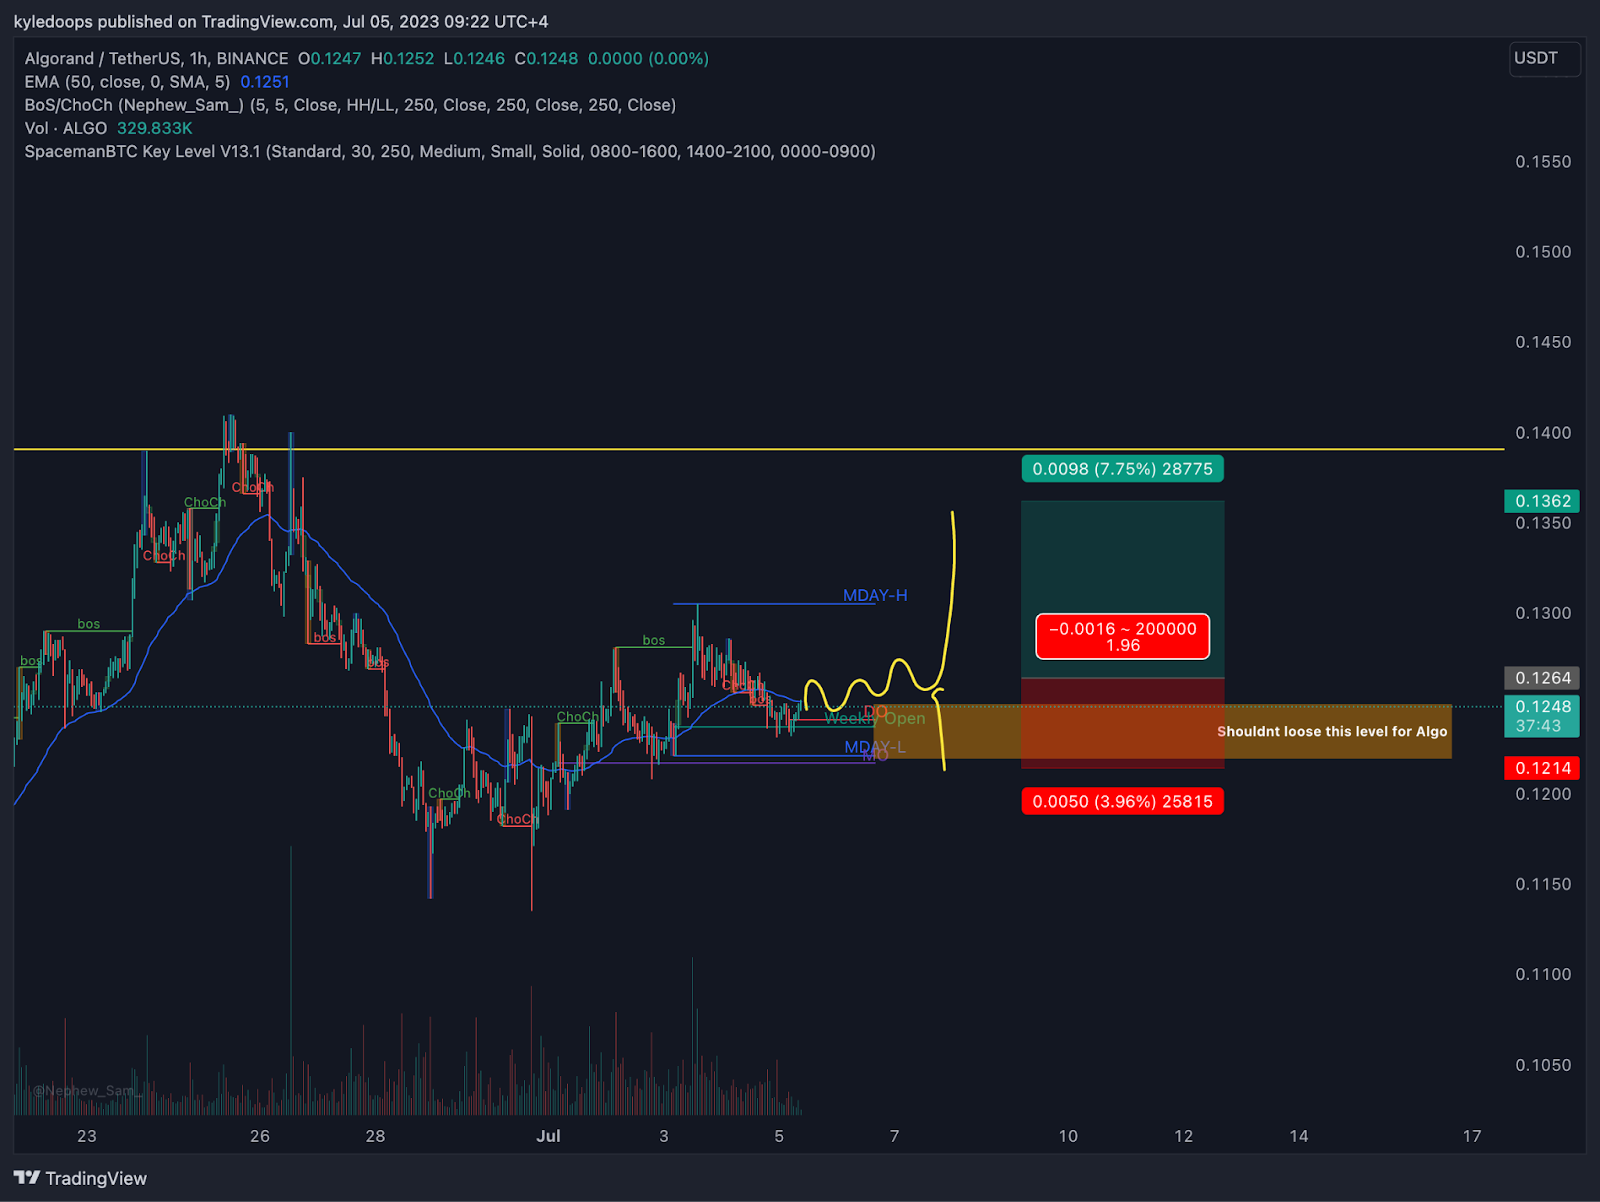
Chart #2 - Algorand (ALGOUSDT) 1-Hour Chart
Chartist: Kyle
(For the chart screenshot, click here.)
ALGO has a potential trade opportunity at the moment.
The risk-reward ratio isn't the largest, but given the range, it's likely to revisit the top of that range.
We’ll set a stop loss at $0.124.
We’ll aim to take profit at $0.1362.
And we’ll monitor to ensure it maintains a level above Monday's low, and aim for a sweep back above Monday's high.
𝗣𝗿𝗶𝗺𝗲 𝗫𝗕𝗧
Sign up for a new Trading Account on Prime XBT!
Receive a deposit bonus of up to $7,000 with promo code: KyleDoops

Sign up for a new Trading Account on Prime XBT!
Receive a deposit bonus of up to $7,000 with promo code: SheldonSniper
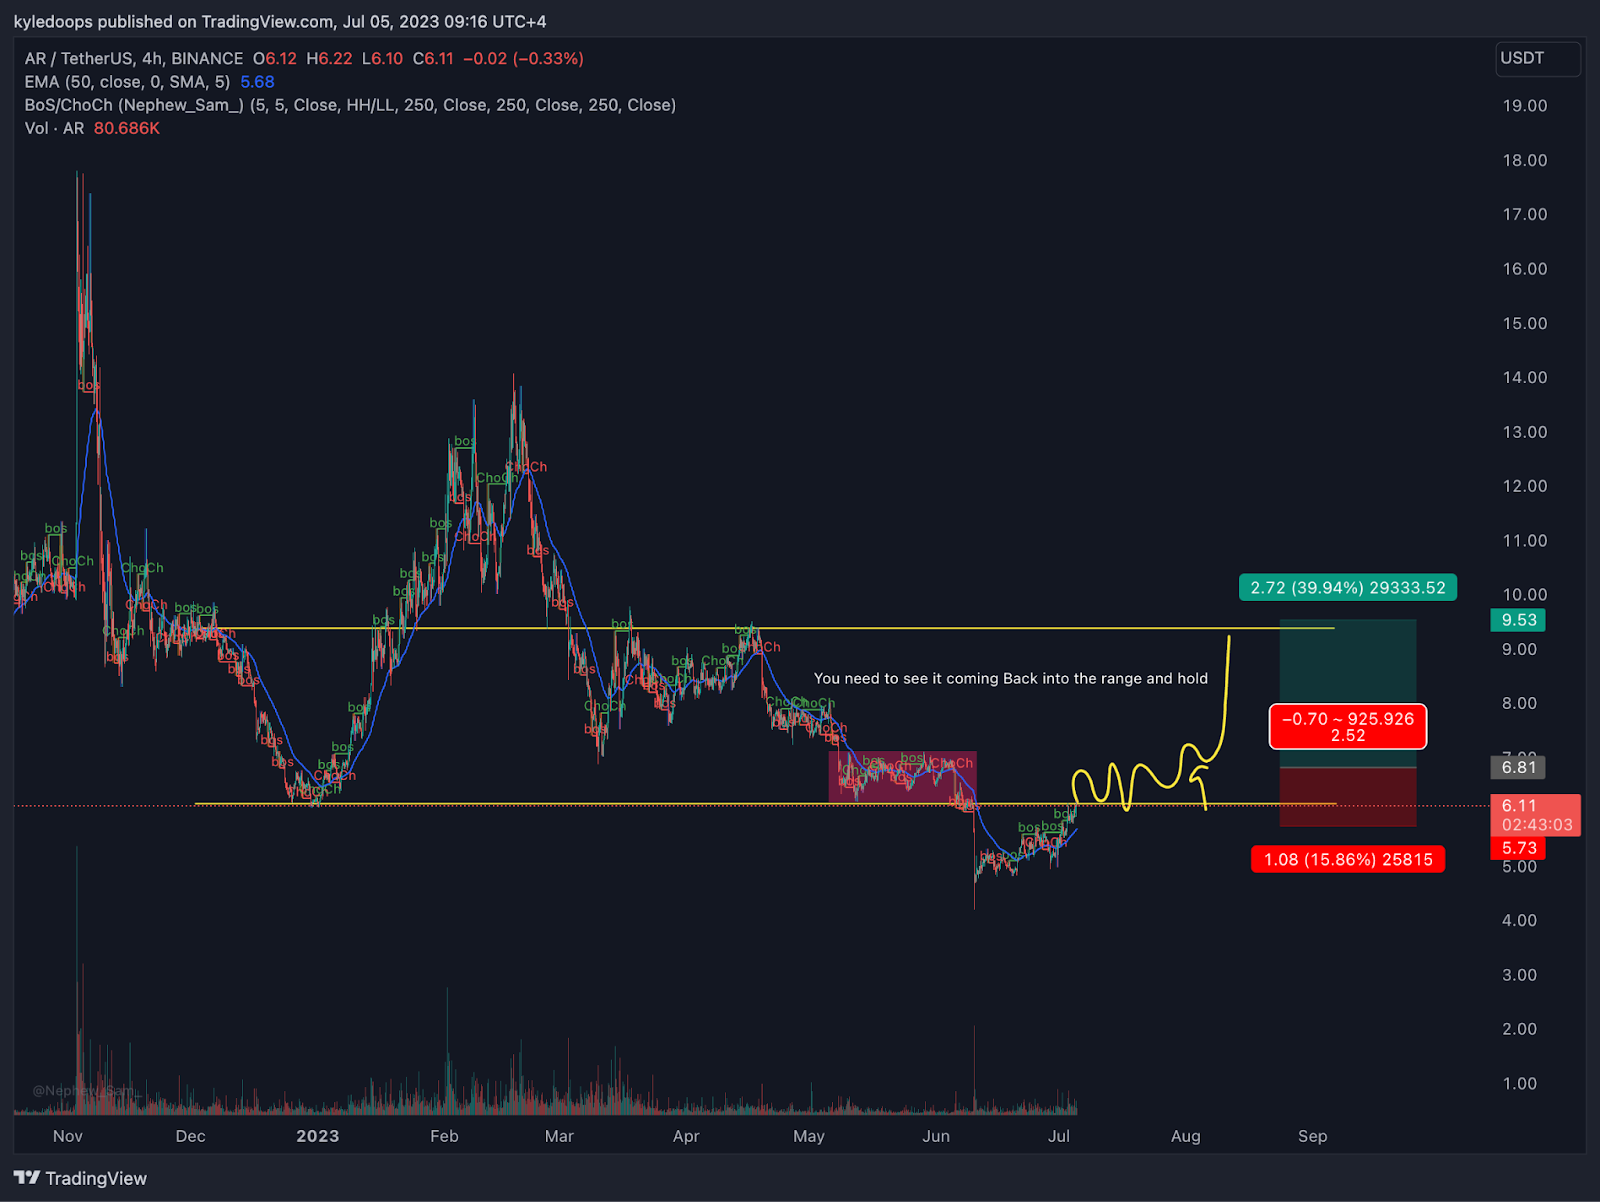
Chart #3 - Arweave (ARUSDT) 4-Hour Chart
Chartist: Kyle
(For the chart screenshot, click here.)
AR is also setting up for a potential long trade.
We’ll wait for AR to deviate back into the range, thereby reclaiming the range low. This should be followed by a re-test back into that level, creating a trade opportunity.
The target is to move back up to the range high at $9.53, which would represent an almost 40% increase. Therefore, this is a lower-leverage swing trade opportunity.
Claim your Bitget sign-up bonuses here (details below).
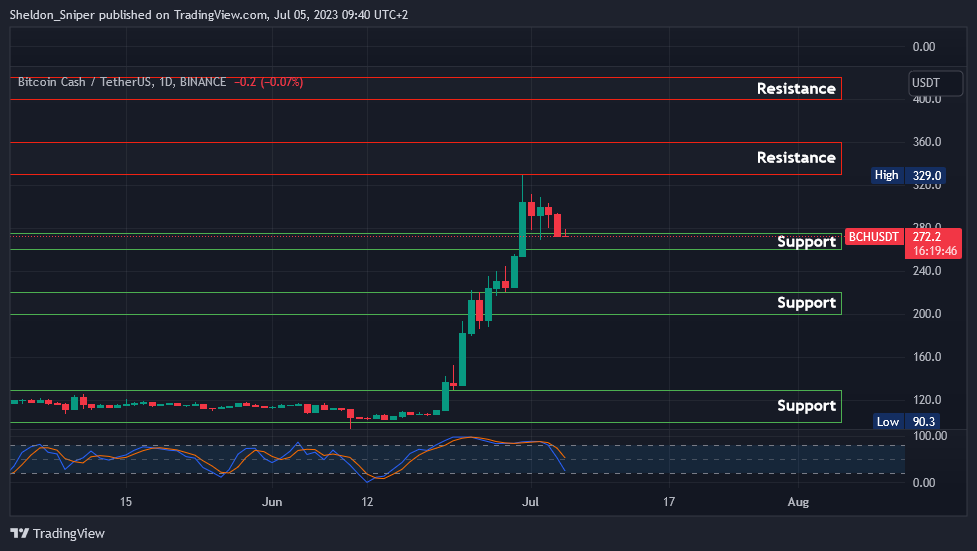
Chart #4 - Bitcoin Cash (BCHUSDT) 1-Day Chart
Chartist: Sheldon
(For the chart screenshot, click here.)
Bitcoin Cash's price had been consolidating between $110 - $140 for nearly a year before breaking to the upside two weeks ago.
The price has rallied by over 250% before meeting resistance in the $330 - $360 area. It has now retraced to $260 - $270, where it should stabilize, possibly setting up the next upward move.
If the price can break through the $330 - $360 area, the next resistance is at $400 - $420.
However, if a deeper retracement occurs from this point, the next support area is at $200 - $220. Bitcoin Cash was trading at over $1,600 two years ago, and I believe the recent move over the past two weeks may just be the start of potentially more upside for BCH in the coming weeks.
Claim your Bitget sign-up bonuses here (details below).
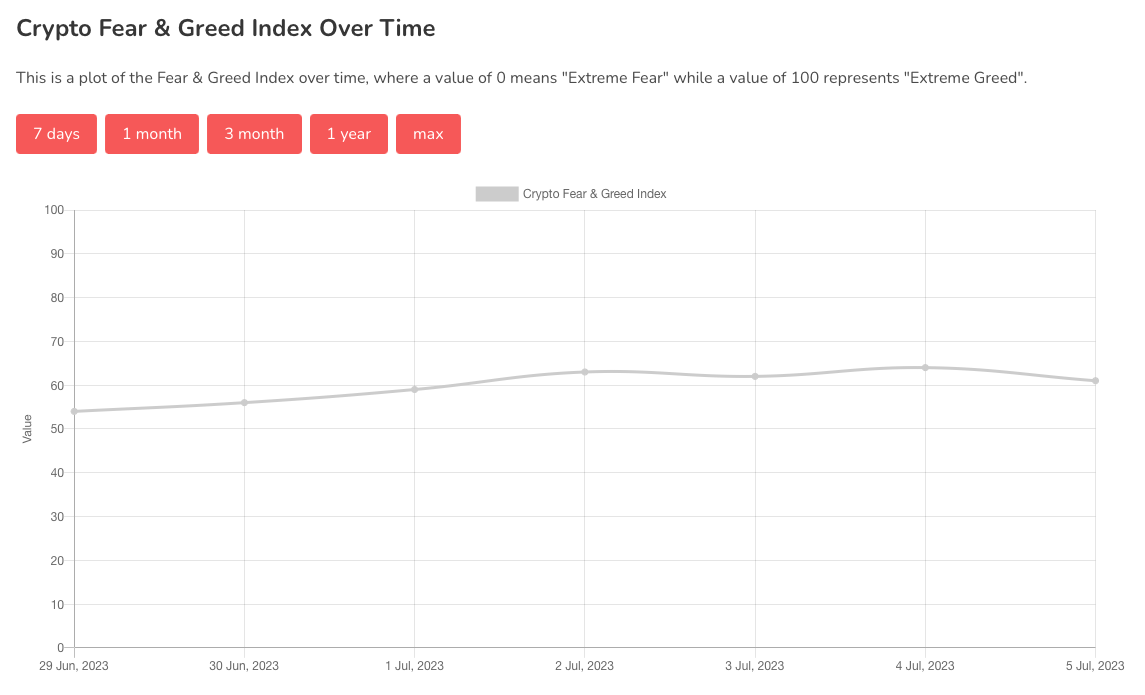
Chart #5 - Bitcoin Fear and Greed Index
The Bitcoin Fear and Greed Index is sitting at 61 today, indicating Greed.
The highest the index has been over the past seven days is 64, and the lowest is 54.
Banter’s Take
Expect some volatility today as the stock market reopens following yesterday's 4th of July bank holiday.
Bitcoin continues to remain range-bound between $30,400 and $32,000.
Stay safe my friends!
Go to our Crypto Banter Discord here where Sheldon and Kyle give updates on the charts and trades from The Daily Candle newsletter!