

📈📉 Time To Trade PEPE? Bitcoin Faces Dilemma!
📈📉 Time To Trade PEPE? Bitcoin Faces Dilemma!

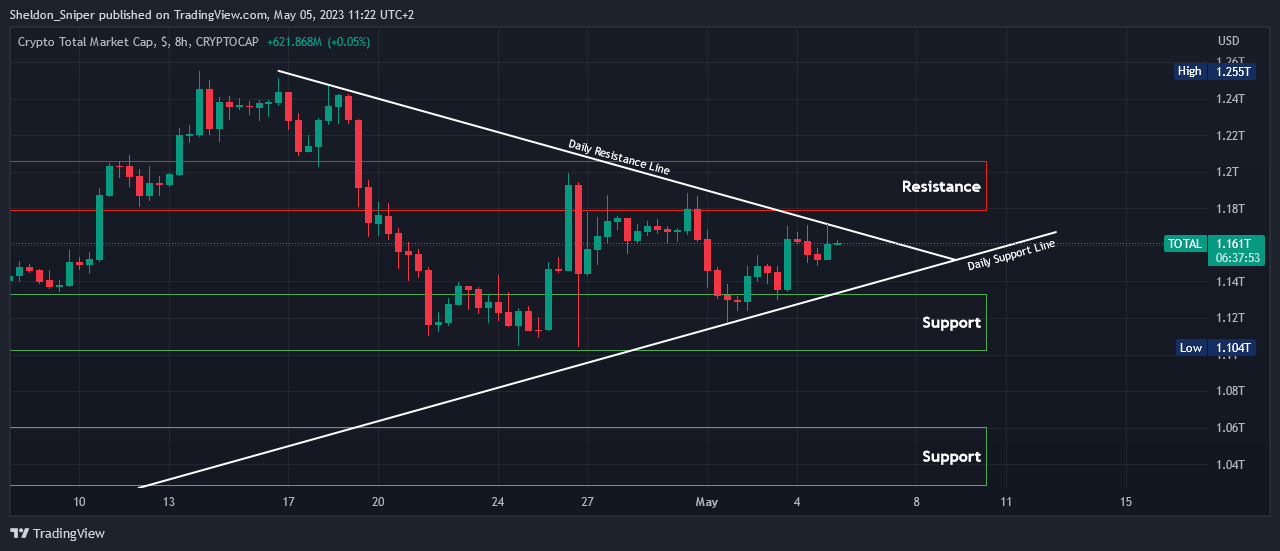
Chart #1 - TOTAL 8-Hour Chart
Chartist: Sheldon
(For the chart screenshot, click here.)
Over the past two weeks, the TOTAL has been fluctuating within a range, with support at $1.10 trillion and resistance at $1.18 trillion.
During that time, a pennant pattern has emerged on the 8-hour chart, forming progressively lower highs and higher lows. As the TOTAL approaches the end of the formation, it will either break above the daily descending resistance line or below the daily ascending support line.
Currently, the TOTAL stands at $1.16 trillion. If it breaks above the daily resistance line, it could potentially reach the next resistance levels between $1.18 trillion - $1.20 trillion, and may even test the existing high resistance at $1.25 trillion. On the other hand, if the daily support line is breached, the TOTAL could drop to the next support range of $1.10 trillion - $1.13 trillion. Should this support fail to hold, the subsequent major support zone is between $1.03 trillion - $1.06 trillion.
𝗣𝗿𝗶𝗺𝗲 𝗫𝗕𝗧
Sign up for a new Trading Account on Prime XBT!
Receive a deposit bonus of up to $7,000 with promo code: SheldonSniper
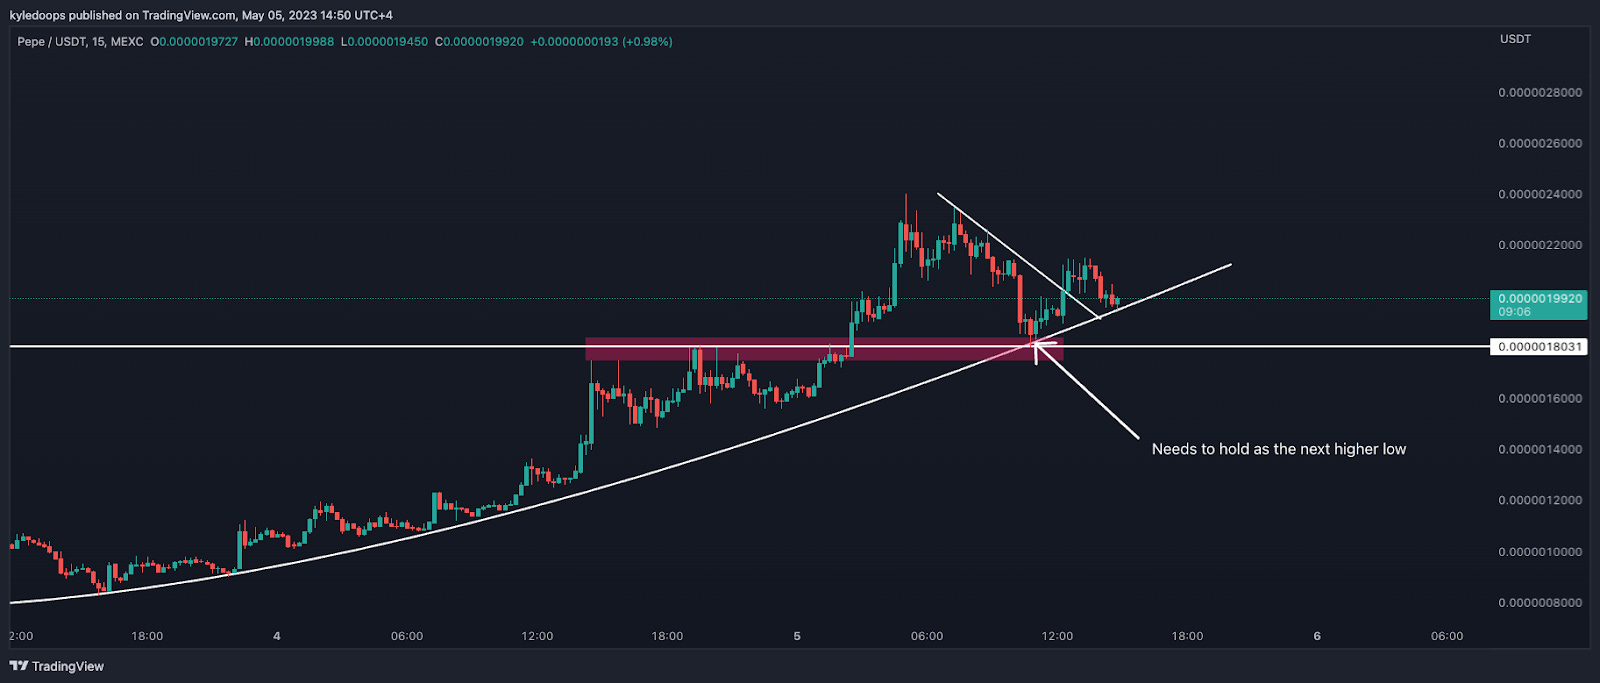
Chart #2 - PEPE (PEPEUSDT) 15-Minute Chart
Chartist: Kyle
(For the chart screenshot, click here.)
PEPE has been attracting significant liquidity recently. With prices soaring and momentum running strong, this trend likely continues.
For the upward trajectory to persist, the price should ideally maintain support at the $0.0000018031 level, which would establish the next higher low and propel prices further. On the other hand, if this support level is breached, it could indicate that PEPE has reached a local top, leading to a decline in prices.
Given the current market dynamics, it is more probable that this scenario represents a short-term trade rather than a long-term swing trade to be held for months.
𝗣𝗿𝗶𝗺𝗲 𝗫𝗕𝗧
Sign up for a new Trading Account on Prime XBT!
Receive a deposit bonus of up to $7,000 with promo code: KyleDoops

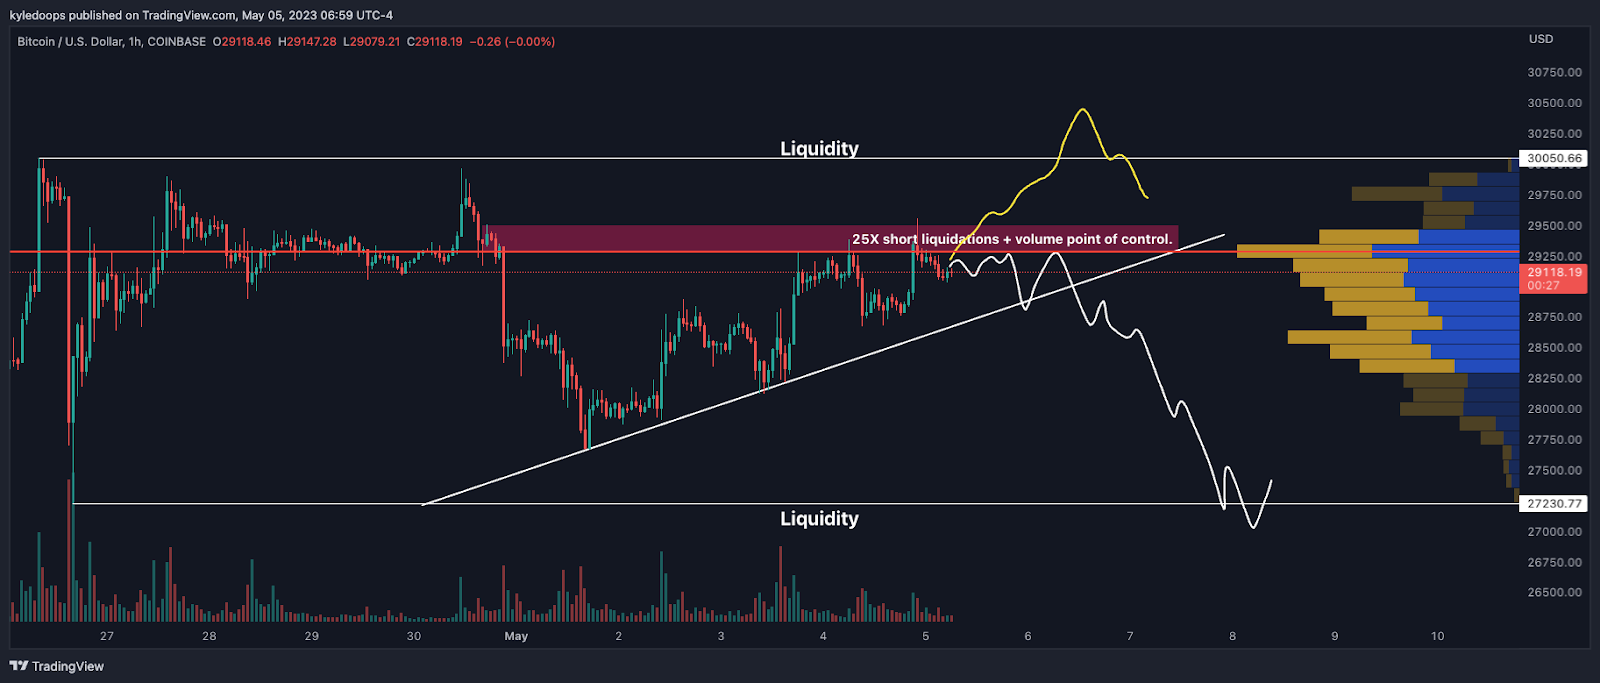
Chart #3 - Bitcoin (BTCUSD) 1-Hour Chart
Chartist: Kyle
(For the chart screenshot, click here.)
Bitcoin is currently trapped below the pink-highlighted box, representing a minor liquidity zone with the point of control at $29,282. You can see on the prior candles that the price pushed directly through that level and rejected immediately after.
I have outlined two potential paths:
1. The price could grind below the diagonal trend line, as illustrated by the white lines, which would initiate a short trade with a stop above the wick at $29,600 and a target at the lower liquidity level of $27,230. If this level is swept, it could present a long trade opportunity when the price re-enters the range.
2. Alternatively, the price might target higher liquidity, as shown by the yellow lines. In this case, we will not short immediately; instead, we’ll observe how the price reacts and whether it re-enters the range. Once the price is accepted back within the range, a short trade can be executed.
Claim your Bitget sign-up bonuses here (details below).
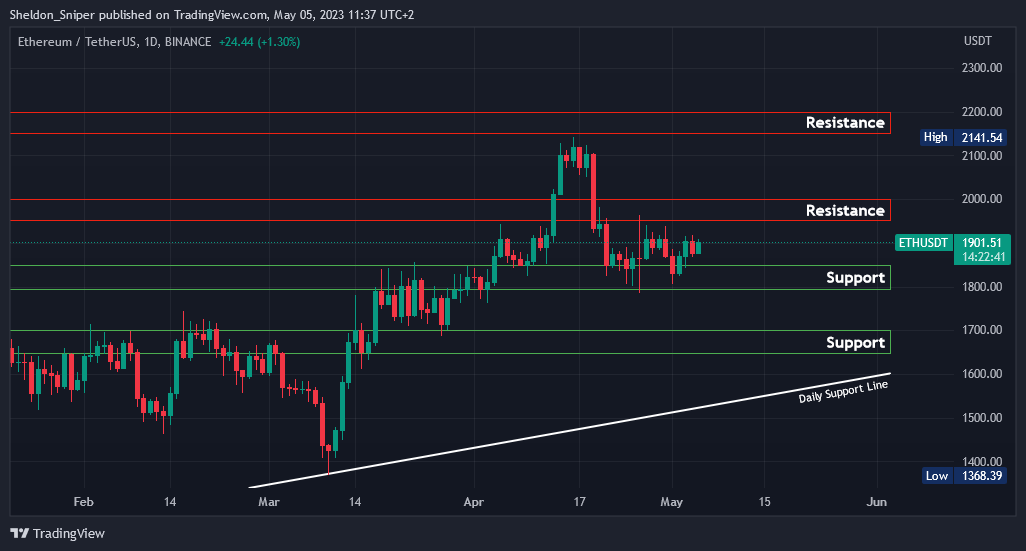
Chart #4 - Ethereum (ETHUSDT) 1-Day Chart
Chartist: Sheldon
(For the chart screenshot, click here.)
Over the past two weeks, ETH, along with most other coins, has been consolidating and range-bound trading.
ETH's price has been fluctuating between major support at $1,800 and resistance around $1,900, while both BTC and the TOTAL have formed pennant patterns on the 8-hour chart, indicating an imminent decision on the direction of the market.
Should bitcoin break to the upside, it is likely that ETH would follow suit, potentially testing the next resistance levels between $1,950 - $2,000, or even possibly reaching the subsequent resistance range of $2,150 - $2,200. However, if ETH’s price drops from its current level of $1,900, the next support zone lies between $1,800 - $1,850. If this support fails, the following major support range is situated between $1,650 - $1,700.
Additionally, the daily support line, which extends from November, is slightly lower at just below $1,600. This level would also serve as a crucial support level if the price were to test that range.
Claim your Bitget sign-up bonuses here (details below).
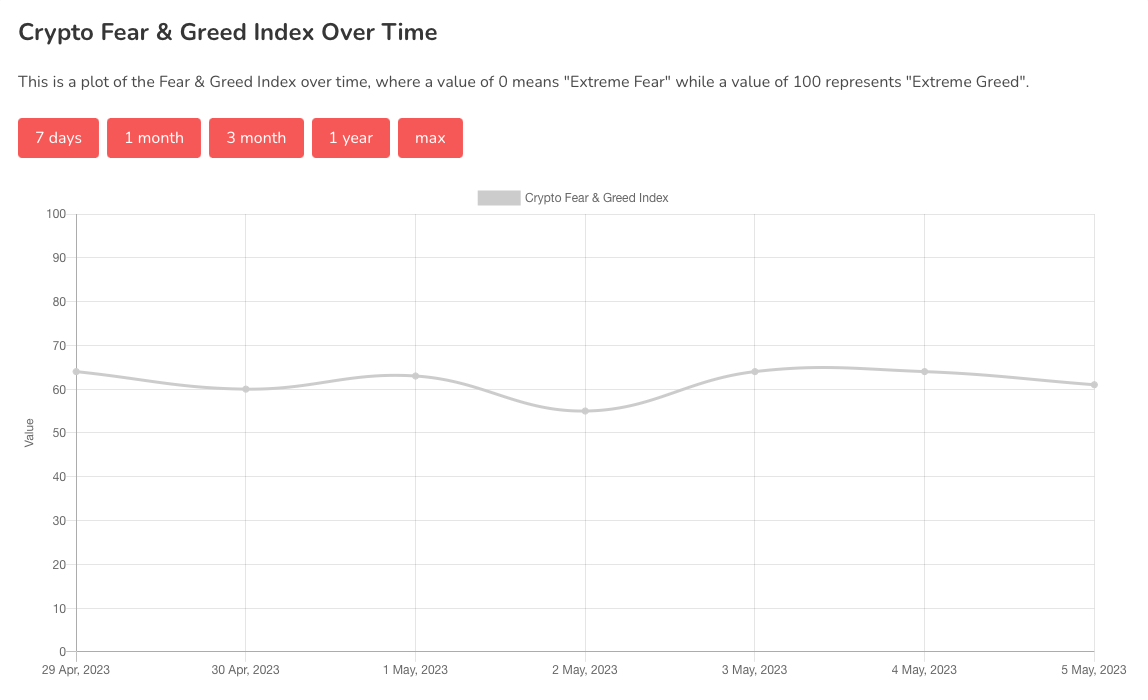
Chart #5 - Bitcoin Fear and Greed Index
The Bitcoin Fear and Greed Index is sitting at 61 today, indicating Greed.
The highest the index has been over the past seven days is 64, and the lowest is 55.
🔥 Trade to Triumph 🔥
Win a Tesla, Rolex & $10,000 Cash!
Don't miss this extraordinary ByBit trading competition by Crypto Banter & Gareth Soloway! Unleash your trading skills for a chance to win a Tesla, Rolex, and $10,000 cash prizes. Secure your spot in this unrivaled contest now and elevate your crypto trading journey.
Register here to join the elite trader's league!
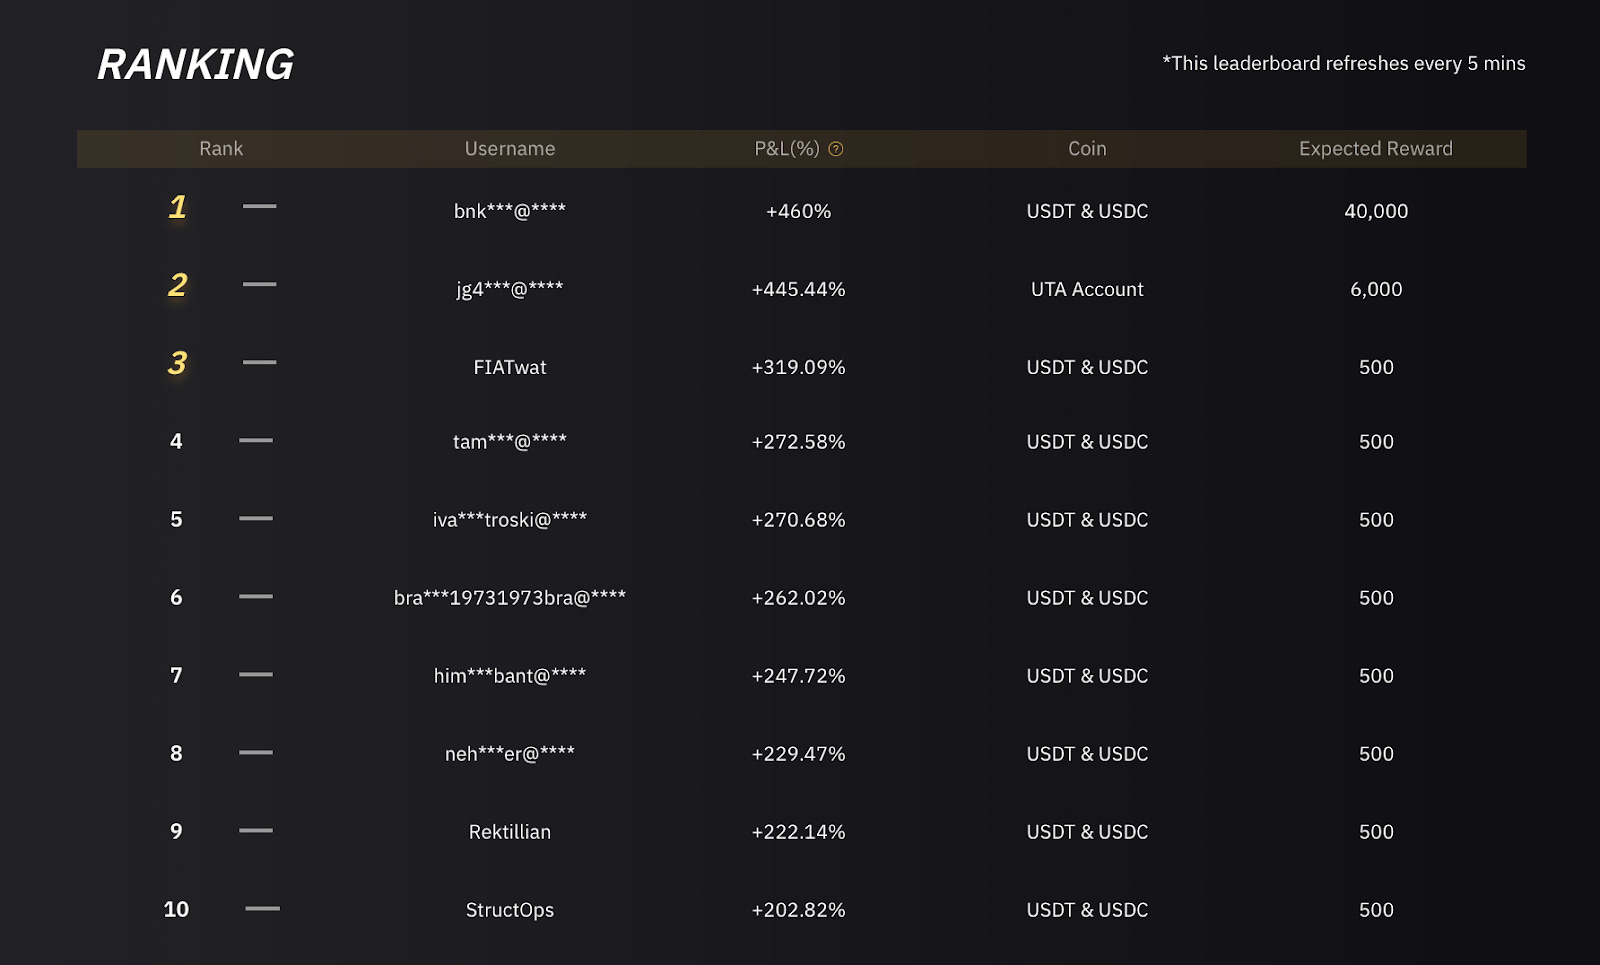
Competition Leaderboard
Banter’s Take
The meme coin market is hot, but it should be treated more as a gamble since the volatility is incredibly high and liquidity in the markets is very low. This means liquidity is being drawn from the broader market and into these memes. Therefore, it will likely be a rotational play, moving from one coin to the next.
Stay safe my friends!
Go to our Crypto Banter Discord here where Sheldon and Kyle give updates on the charts and trades from The Daily Candle newsletter!
Today’s winning UIDs:
Bybit winner - 10270770
Bitget winner - 3305982898