

📈📉 TOTAL3 Breaks Year-Long Trend! Alt PUMP Imminent?
📈📉 TOTAL3 Breaks Year-Long Trend! Alt PUMP Imminent?
If the TOTAL3 Can Break THIS Level, ALL Alts Could SOAR!
Overview
Chart #1 - Ethereum (ETHUSDT) Daily
Chart #2 - Crypto Total Market Cap Excluding BTC and ETH (TOTAL3) Daily
Chart #3 - S&P 500 Futures (ES1!) Daily
Chart #4 - Fantom (FTMUSDT) Daily
Chart #5 - Fear and Greed Index

Chart #1 - Ethereum (ETHUSDT) Daily
Chartist: Sheldon
(For the chart screenshot, click here.)
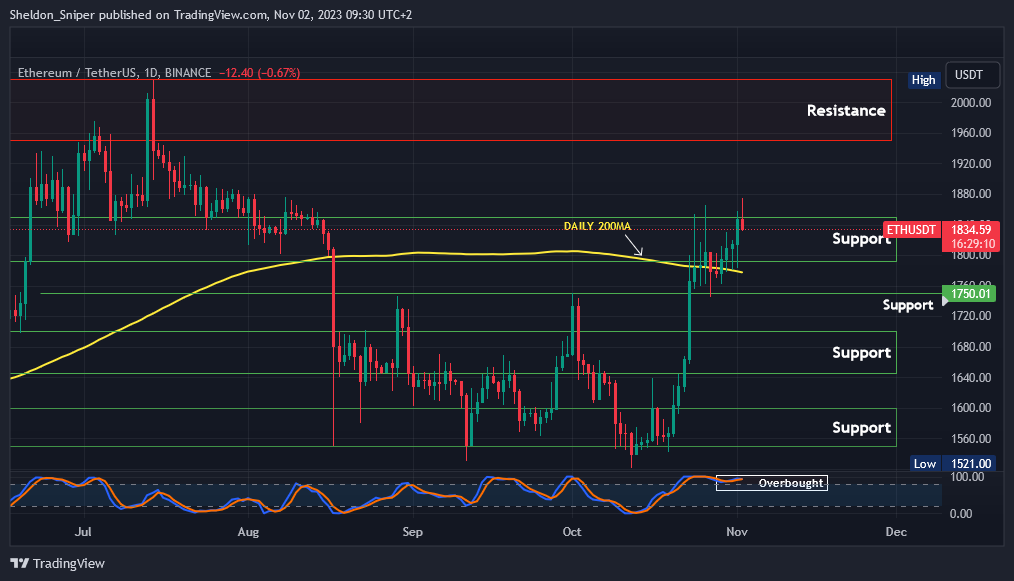
This morning, ETH was once again rejected at $1,870.
It is overbought on the daily time frame and should continue to consolidate between the daily 200 Moving Average (MA) and the $1,850 resistance level for a few days, resetting the indicators for the next leg to the upside.
If ETH breaks through $1,850, the next area of resistance is at $1,950 - $2,050.
Sign-up and trade on Bybit today.
Exclusive $30,000 deposit rewards and bonuses up for grabs!
Chart #2 - Crypto Total Market Cap Excluding BTC and ETH (TOTAL3) Daily
Chartist: Kyle
(For the chart screenshot, click here.)
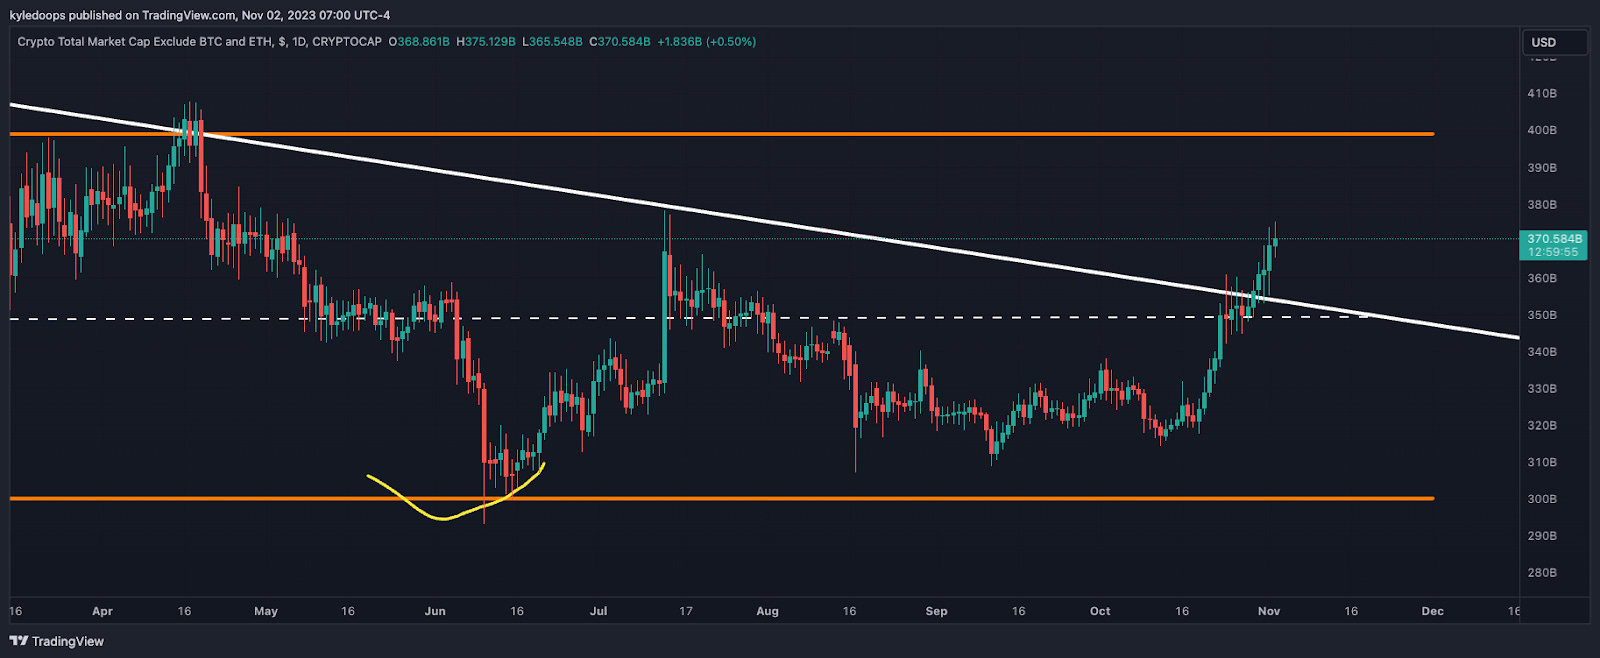
The TOTAL3 is finally breaking its longer-term downtrend it has been in for over a year!
With closing candles now above the last lower high, the structure is shifting. The next level to watch is $400 billion, which was the prior range high.
If the TOTAL3 can surpass that level, a significant breakout for all altcoins might be on the horizon.
Claim your Bitget sign-up bonuses here (details below).

For more premium content like this, be sure to take advantage of our limited offer to the Whale Room Discord at 25% off for the first 3-months.
Apply the promo code “DOOPS”.
Limited to the first 50 people!
Chart #3 - S&P 500 Futures (ES1!) Daily
Chartist: Kyle
(For the chart screenshot, click here.)
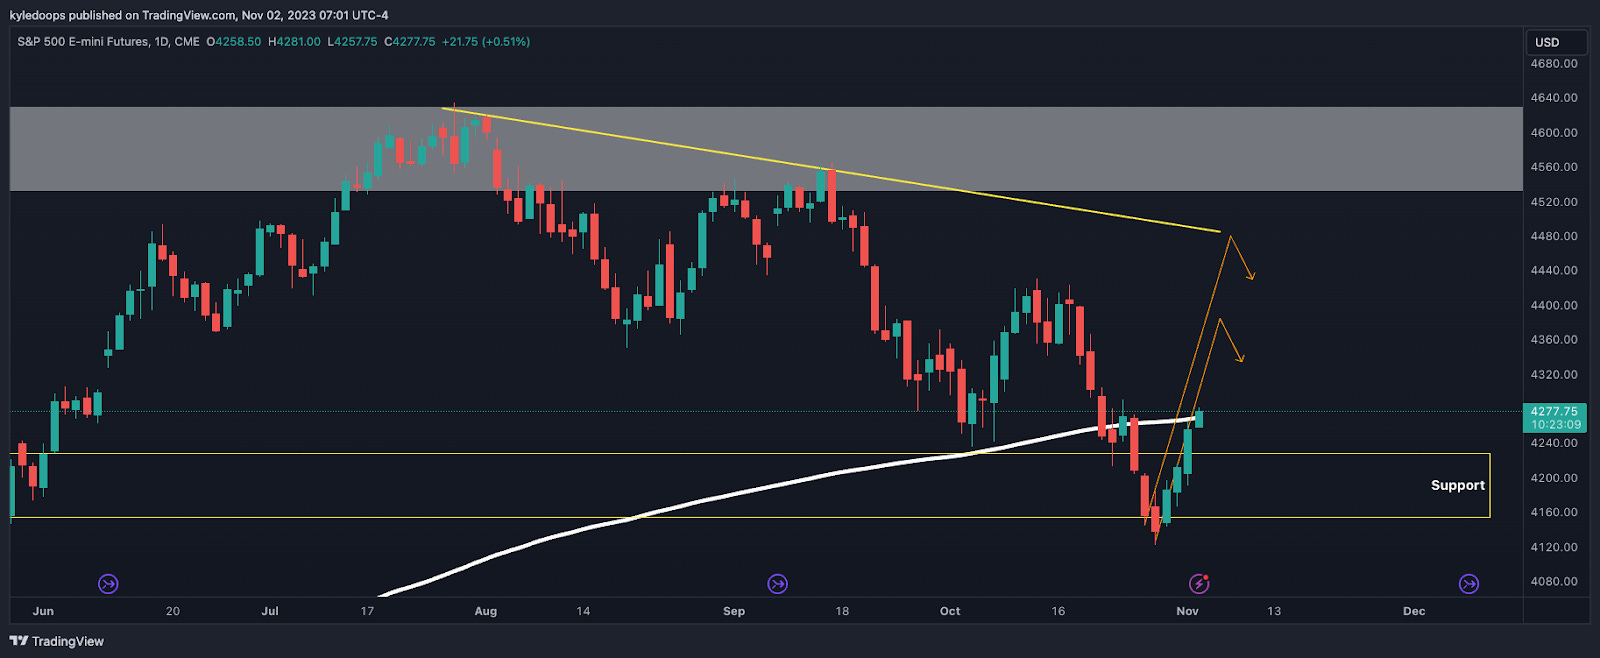
The stock market, on the daily timeframe, has begun to reclaim the 200-day moving average after a robust bounce from a crucial horizontal support.
Multiple closing candles above the 200-day MA would means that the low has been established!
Historically, most major pivot levels occur in October.
Claim your Bitget sign-up bonuses here (details below).
Chart #4 - Fantom (FTMUSDT) Daily
Chartist: Sheldon
(For the chart screenshot, click here.)
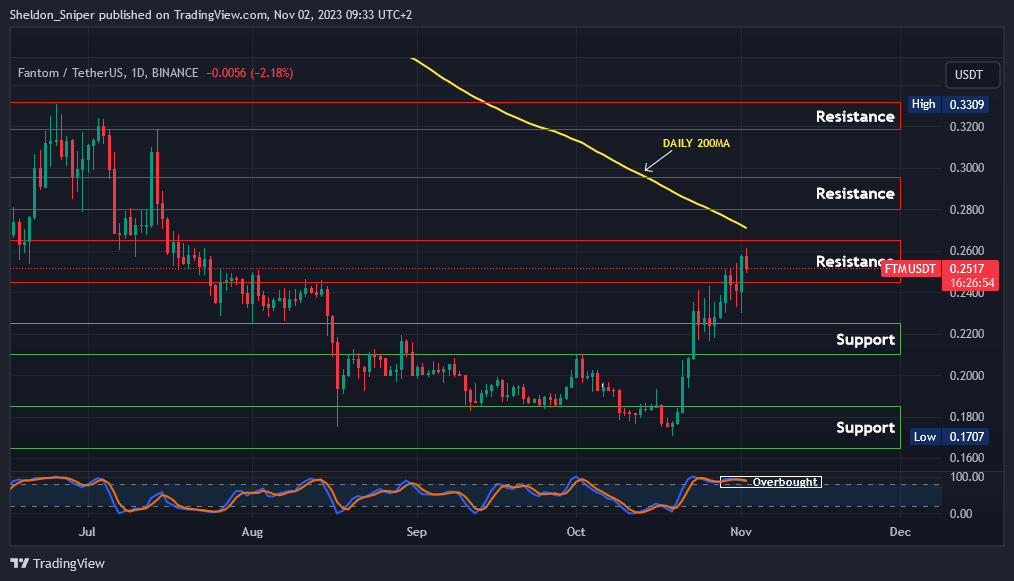
FTM has rallied over 50%, from $0.17 to $0.26! But it’s now losing momentum…
This morning, there was a pullback at the $0.26 resistance level. With the daily 200 MA just above at $0.2650, I believe the $0.26 - $0.2650 area will be challenging to surpass in a single attempt. The price is overbought on the daily timeframe, so I anticipate a pullback to test lower support areas.
The first support level is at the range's low resistance of $0.2450, followed by a support zone at $0.21 - $0.2250.
Claim your Bitget sign-up bonuses here (details below).

🚀 Sniper School's New Cohort Begins November 7th!
Sniper School is a free 3-week trading course led by Sheldon. Dive deep into his strategies and insights to master the art of trading. Equip yourself with the skills to capitalize on market shifts and maximize your gains.
Limited Seats! With only 3,000 seats available, our waitlist fills up rapidly! Secure Your Seat Today!
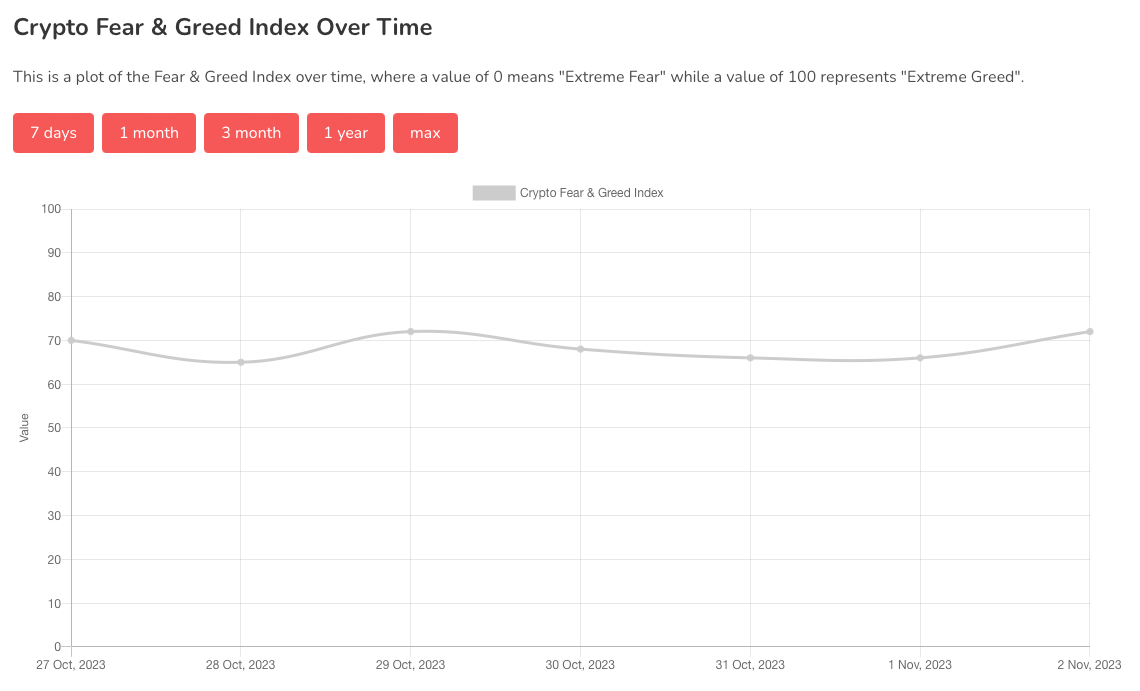
Chart #5 - Fear and Greed Index
The Fear and Greed Index is sitting at 72 today, indicating Greed.
The highest the index has been over the past seven days is 72, and the lowest is 65.
Banter’s Take
The market is showing an increased appetite for risk, but exercise caution when chasing pumps, as many altcoins may experience sharp pullbacks.
Stay safe my friends!
Go to our Crypto Banter Discord here where Sheldon and Kyle give updates on the charts and trades from The Daily Candle newsletter!