

📈📉 Trade Alert: BNB Big Move Imminent!
📈📉 Trade Alert: BNB Big Move Imminent!
WARNING! Crypto Market Volatility Incoming!
Overview
Chart #1 - Cardano (ADAUSDT) Daily
Chart #2 - THORChain (RUNEUSDT) Daily
Chart #3 - BNB (BNBUSDT) Daily
Chart #4 - Bitcoin (BTCUSDT) 12-Hour
Ride the BTC waves with Put Ratio spreads amidst market volatility Breakout: With Deribit’s Anand
Chart #1 - Cardano (ADAUSDT) Daily
Chartist: Sheldon

(For the chart screenshot, click here.)
Some alts are testing levels of support, including ADA. This presents an opportunity to go into a long trade, and target the higher resistance levels.
Entry: Enter into a spot long trade in the current $0.57 level of support.
Take Profits (TP):
TP1: $0.64 - $0.70 (12% - 23%)
TP2: $0.80 - $0.85 (40% - 49%)
Stop Loss: Just below $0.52
Please take note BTC could retrace further, bringing the market down with it. We must manage our risk tightly over the next few days.
Sign-up and trade on Bybit today.
Exclusive $30,000 deposit rewards and bonuses up for grabs!
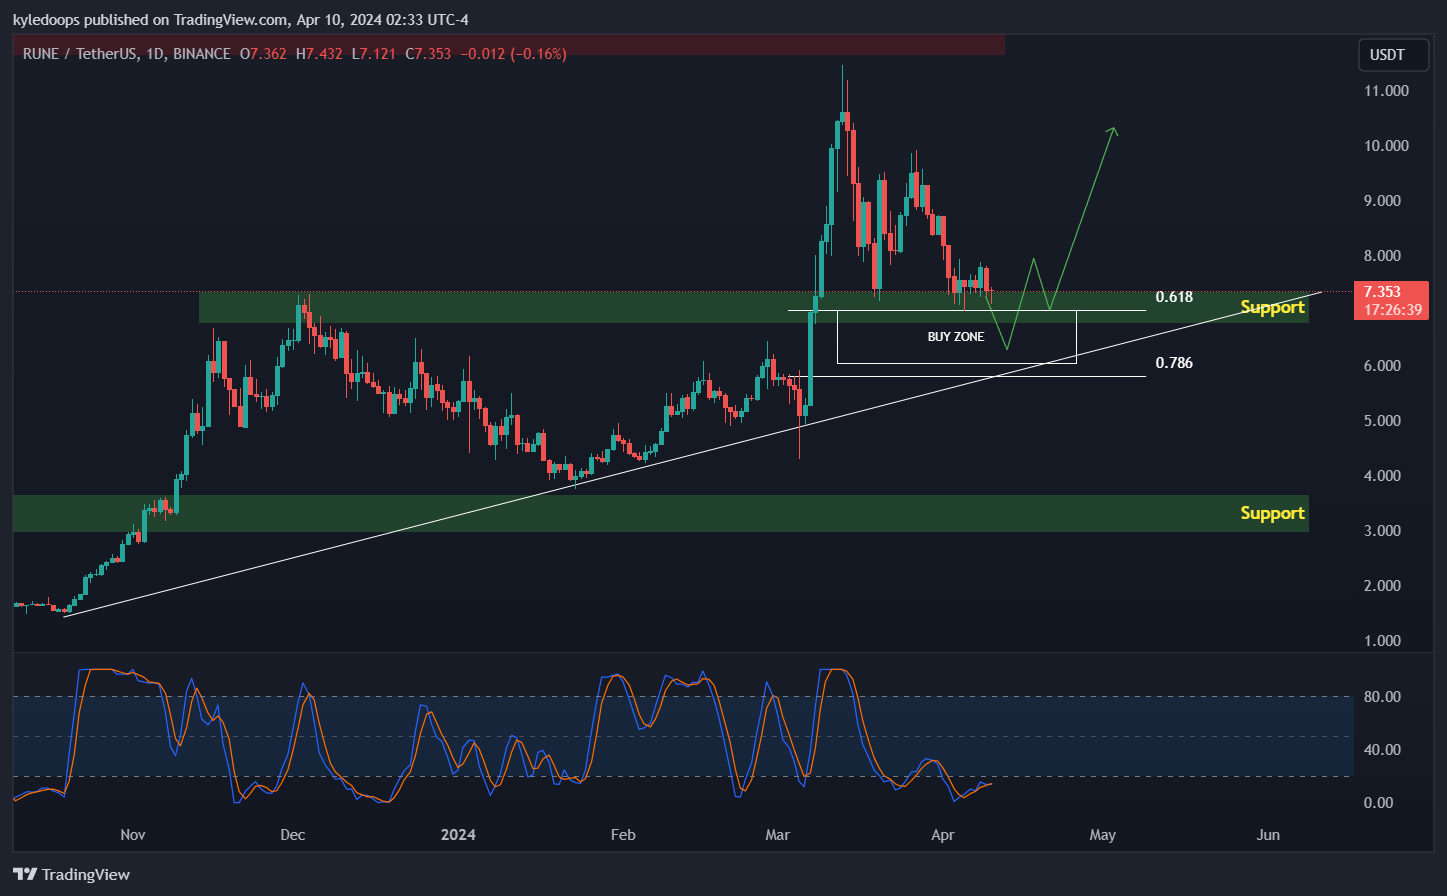
Chart #2 - THORChain (RUNEUSDT) Daily
Chartist: Kyle
(For the chart screenshot, click here.)
Long Term trade:
RUNE is expected to perform very well during the bull run.
It has retraced to a key area of interest. The trade is to look for a deviation below support to ladder in to 30% of the trade. We’ll double up on volume if price reclaims the 0.618 Fibonacci support, giving a higher high, higher low from the deviation.
Alternatively, we’ll maintain dry powder to DCA into the position at the next key support area between $3 - $4.
Claim your Bitget sign-up bonuses here (details below).

Outsmart 99% Of The Market!
Get full access into our Discord And Telegram group, where you'll find all of our premium content!
👉 Trade Signals!
👉 Trade Set-Ups!
👉 Trading Challenges!
👉 Education!
👉 SO MUCH MORE!
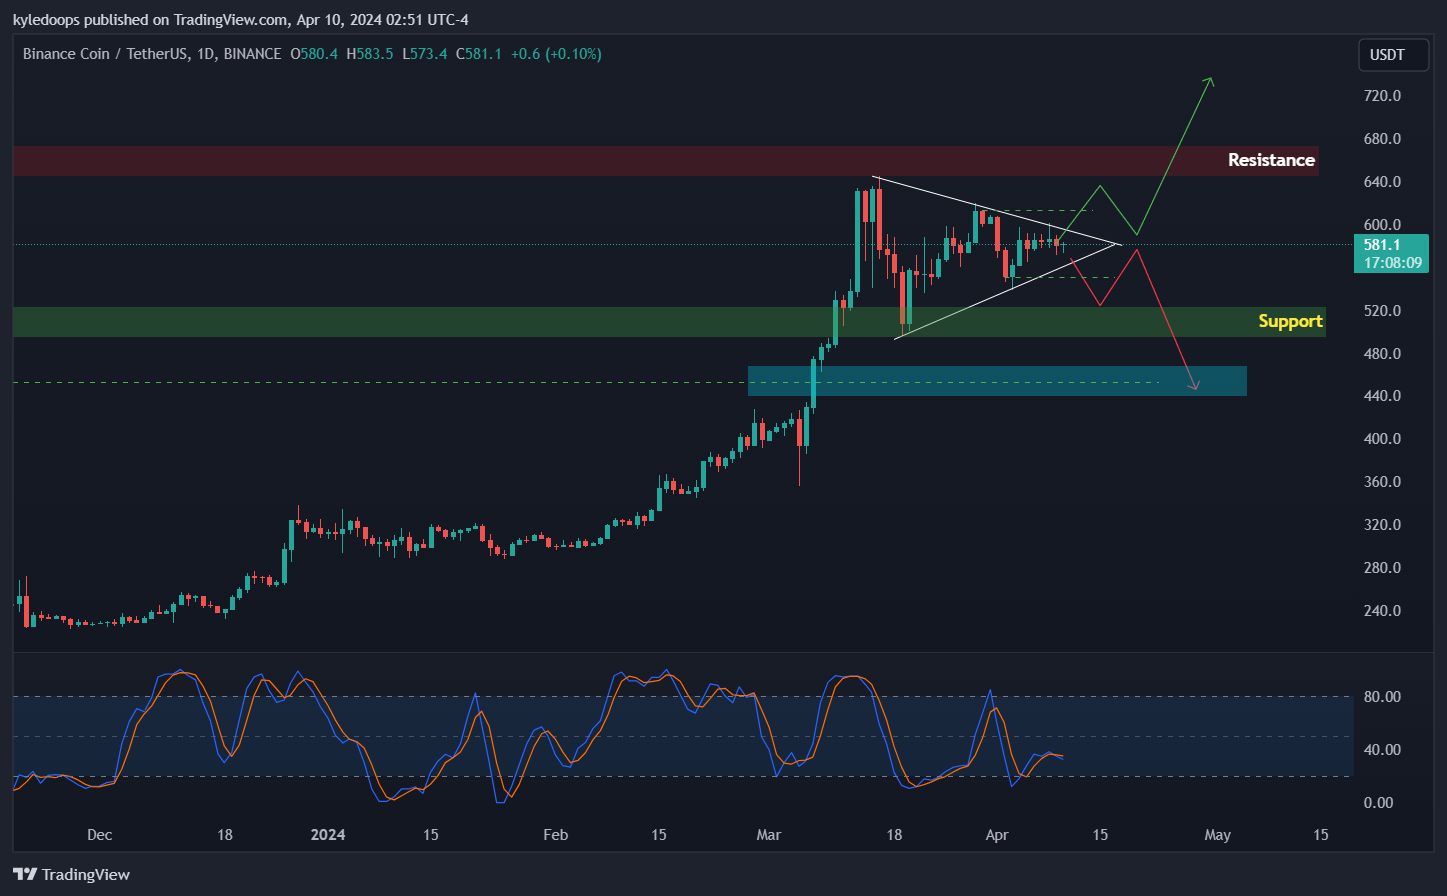
Chart #3 - BNB (BNBUSDT) Daily
Chartist: Kyle
(For the chart screenshot, click here.)
BNB is forming a bullish pennant underneath its All-Time High (ATH).
A bullish pennant has a 55% chance of breaking to the upside. Our best bet here is to wait for the chart to either break its previous low or previous high to improve accuracy, and then trade the trend.
The targets are:
Upside - Into price discovery alongside BTC
Downside - To fill the imbalance in price at $440
Claim your Bitget sign-up bonuses here (details below).
Chart #4 - Bitcoin (BTCUSDT) 12-Hour
Chartist: Sheldon

(For the chart screenshot, click here.)
Yesterday, BTC saw another rejection around the $72,000 level, and the price has dropped to $69,000.
BTC has shown strong momentum over the past few months, so I anticipate that the price might consolidate within the range of $60,000 to $70,000 for some time.
Claim your Bitget sign-up bonuses here (details below).
Ride the BTC waves with Put Ratio spreads amidst market volatility Breakout: With Deribit’s Anand

Bitcoin has displayed notable retracements following its breakout from the symmetrical triangle pattern. 1H timeframe shows that the demand zone that facilitated the breakout failed to hold during yesterday’s market sell-off and is now serving as resistance to BTC’s upward movement, further aided by Bitcoin ETF outflows.
The next significant demand zone is around $62,000, which was responsible for propelling prices to a high of $73,800. This demand zone might serve as a potential pause in the BTC sell-off, enabling participants to capitalize on gains using the suggested strategy. Hence, traders can utilize a put ratio spread strategy to benefit from potential price declines amidst market volatility.
Trade Structure
(OTM Put) Buy 1x BTC-12APR24-$64,000-P @ $160
(OTM Put) Sell 2x BTC-12APR24-$62,000-P @ $78
Payouts
Maximum Profit: $1,996/BTC
Debit of Strategy: $4/BTC
If the Bitcoin price is at $62,000 when the options expire on April 12th, traders will achieve maximum profit from this strategy.
Banter’s Take
Bitcoin is currently retracting towards $69,000, testing it as support. The critical level to monitor is at $67,500; any close below this may lead to a move towards $64,000, with potential further downside towards $55,000 if broken. Alternatively, if $69,000 holds, we could see a move upwards to retest highs and establish a higher low on the 4-hour chart. It's a wait-and-see situation for now; we'll let the markets decide before trading the trend.
Stay safe my friends!
Go to our Crypto Banter Discord here where Sheldon and Kyle give updates on the charts and trades from The Daily Candle newsletter!