

📈📉 Two Altcoin Long Trades For MAJOR GAINS!
📈📉 Two Altcoin Long Trades For MAJOR GAINS!
PLUS: THESE are Bitcoin's Psychological Barriers!
Overview
Chart #1 - Solana (SOLUSDT) Daily
Chart #2 - Polygon (MATICUSD) Daily
Chart #3 - Bitcoin Dominance (BTC.D) Weekly
Chart #4 - Render (RNDRUSDT) 8-Hour
Chart #5 - Fear and Greed Index
Chart #1 - Solana (SOLUSDT) Daily
Chartist: Sheldon
(For the chart screenshot, click here.)
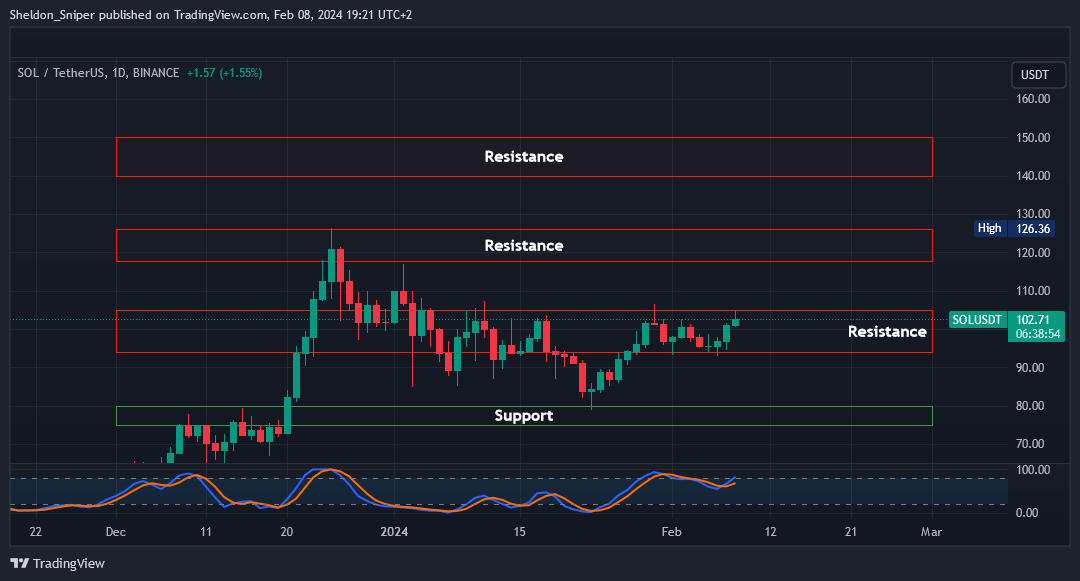
SOL has been bullish over the past few months.
Now there’s potential for a move up. It’s been consolidating within the $94.00 - $105.00 resistance range.
To enter a long trade, I'm awaiting either another test of the $94.00 lower range support or a break above the $105.00 level.
My take profit areas would be: $118 - $125 and $140 - $150, with a stop loss placed just below $93.
Sign-up and trade on Bybit today.
Exclusive $30,000 deposit rewards and bonuses up for grabs!
Chart #2 - Polygon (MATICUSD) Daily
Chartist: Kyle
(For the chart screenshot, click here.)
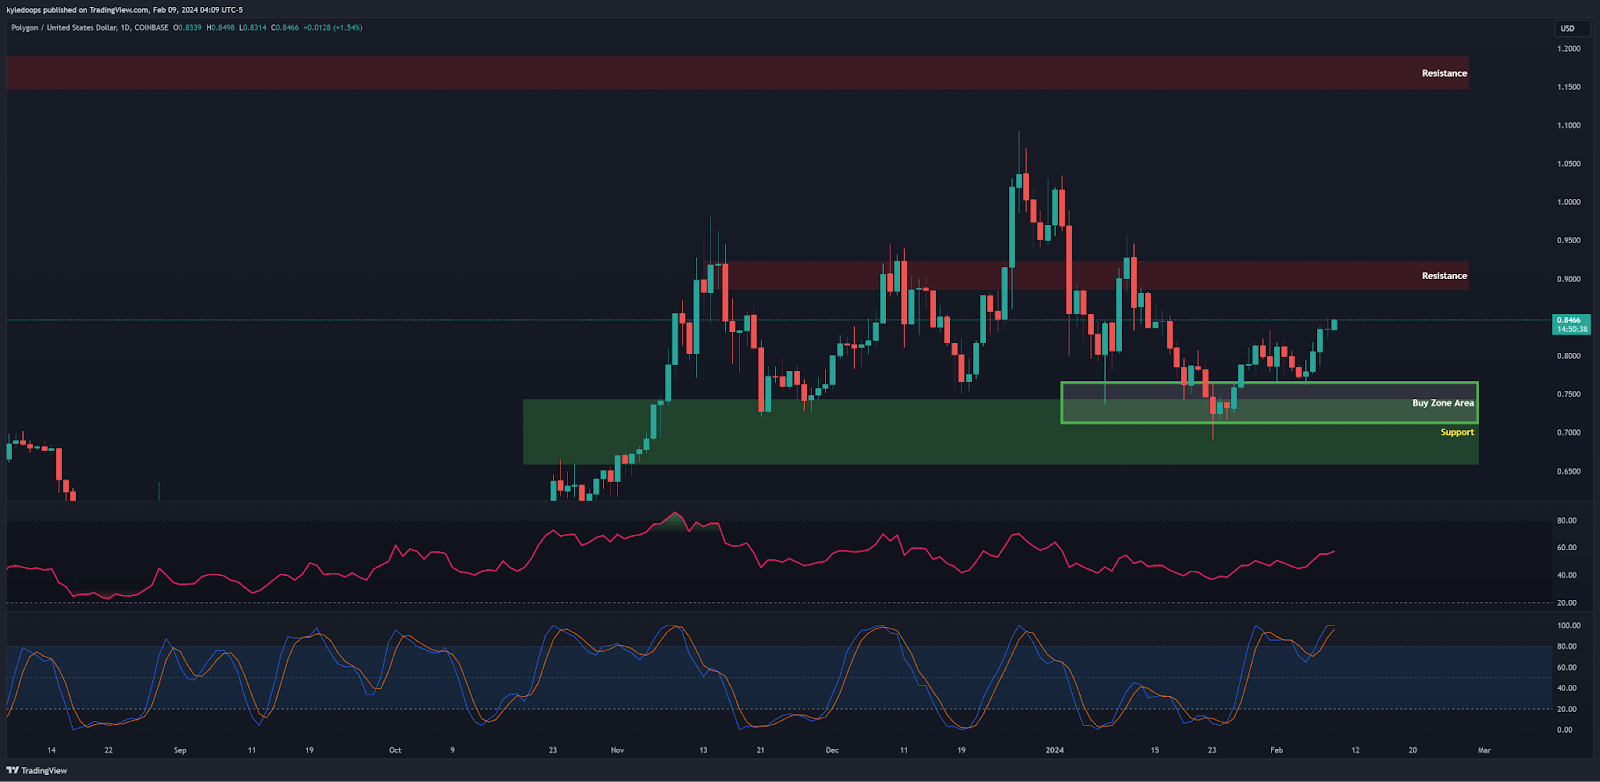
Returning to MATIC, based on previous analysis, it has re-approached the buy zone and is moving away, heading towards the next resistance at $0.88.
Technically, this level represents the top of the range that has been forming since last November.
There should be a reaction at this level, with BTC once again influencing the market dynamics.
Claim your Bitget sign-up bonuses here (details below).

Outsmart 99% Of The Market!
Get full access into our Discord And Telegram group, where you'll find all of our premium content!
👉 Trade Signals!
👉 Trade Set-Ups!
👉 Trading Challenges!
👉 Education!
👉 SO MUCH MORE!
Chart #3 - Bitcoin Dominance (BTC.D) Weekly
Chartist: Kyle
(For the chart screenshot, click here.)
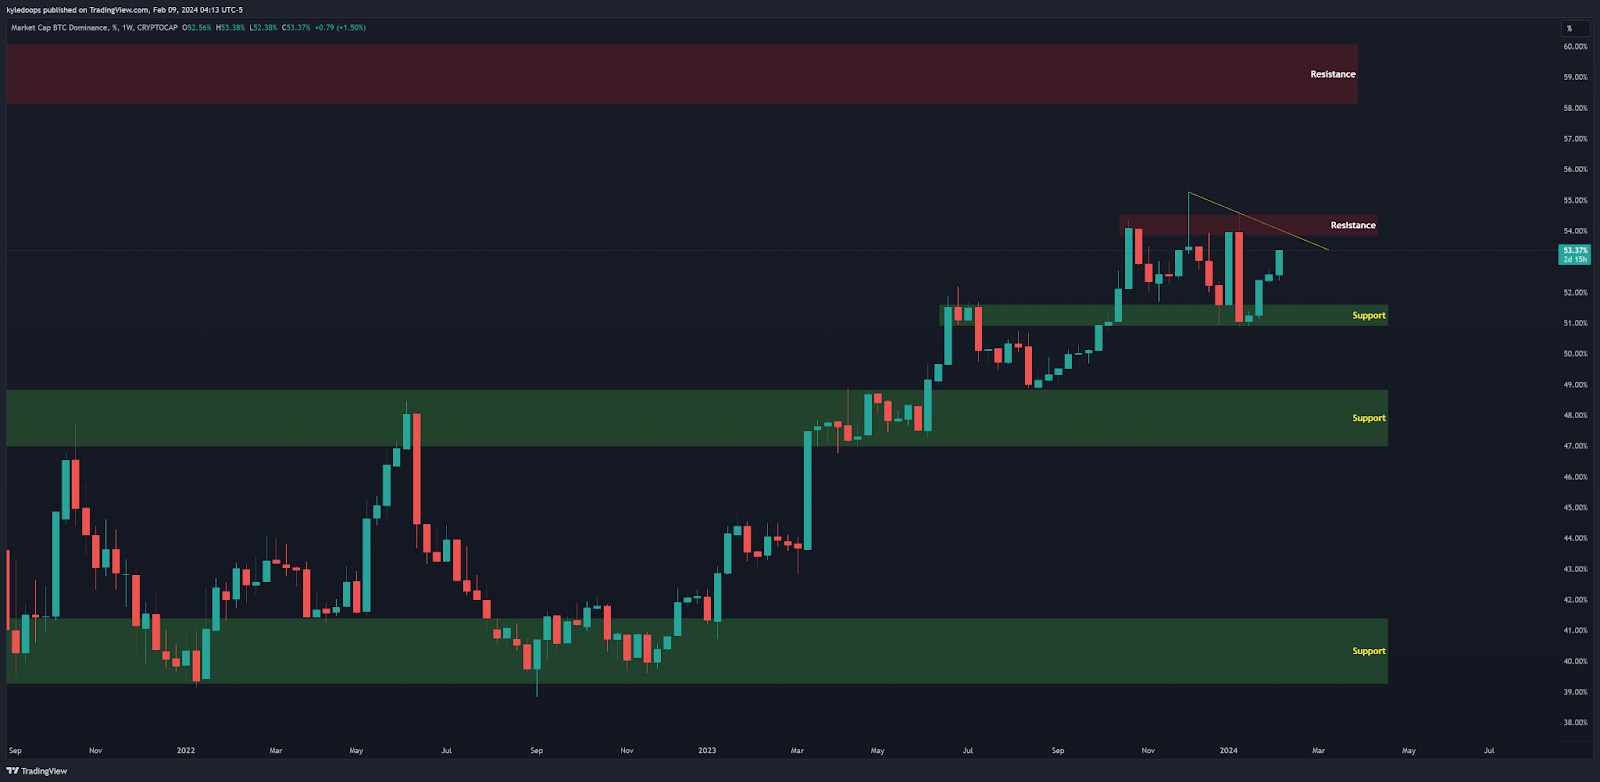
Dominance is poised for another run towards resistance at 54%, showing strength since mid-January.
It will hit a resistance zone and a downtrend formed by the two previous weekly highs, presenting two scenarios: it either breaks above or gets rejected and heads down to support at 51.5%.
Additionally, when Bitcoin Dominance is declining and Bitcoin price remains in price discovery mode, it provides an opportunity for altcoins to further rally.
Claim your Bitget sign-up bonuses here (details below).
Chart #4 - Render (RNDRUSDT) 8-Hour
Chartist: Sheldon
(For the chart screenshot, click here.)
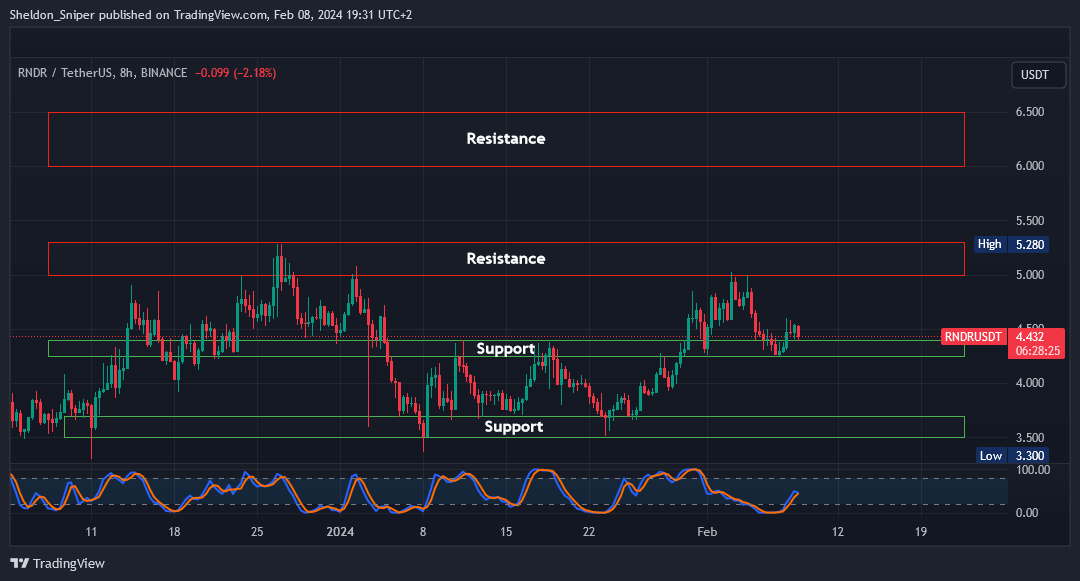
RNDR is testing the top of the range support level at $4.40 in the last day.
So there’s an opportunity for a long trade here.
Take profits at $5.00 - $5.30 and then at $6.00 - $6.50.
The stop loss would be placed just below the lower support level, approximately at $4.18.
Claim your Bitget sign-up bonuses here (details below).
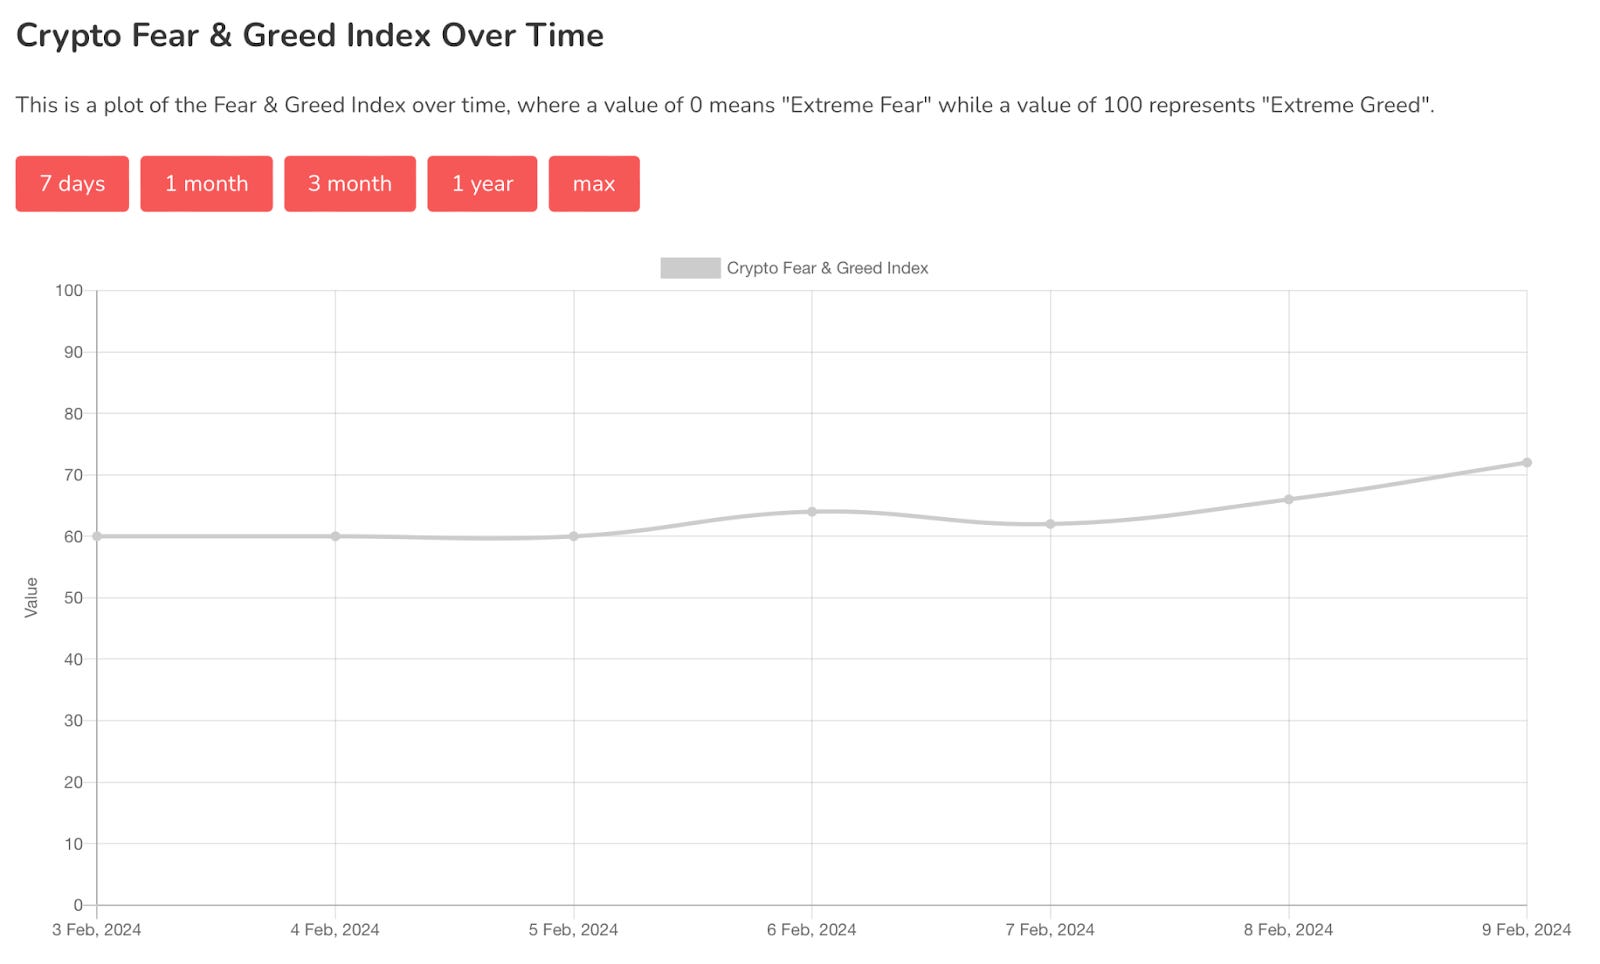
Chart #5 - Fear and Greed Index
The Fear and Greed Index is sitting at 72 today, indicating Greed.
The highest the index has been over the past seven days is 72, and the lowest is 60.
Banter’s Take
Since February 7th, BTC has been moving with strong momentum, targeting the $48,000 area for the second time this year.
Today, we anticipate encountering resistance levels at $47,000, $48,000, and $50,000. These round numbers indicate psychological levels. On the flip side, we observe support at $42,700. It is advisable to pay attention to these levels and plan trades accordingly.
Stay safe my friends!
Go to our Crypto Banter Discord here where Sheldon and Kyle give updates on the charts and trades from The Daily Candle newsletter!