

📈📉 Two Altcoin Trades You CAN'T MISS!
📈📉 Two Altcoin Trades You CAN'T MISS!
PLUS: THESE Ethereum Tokens Are Gaining STRENGTH!
Overview
Chart #1 - Avalanche (AVAXUSDT) 8-Hour
Chart #2 - Bitcoin (BTCUSD) Daily
Chart #3 - Toncoin (TONUSDT) Weekly
Chart #4 - Gala (GALAUSDT) 8-Hour
Chart #5 - Fear and Greed Index
Chart #1 - Avalanche (AVAXUSDT) 8-Hour
Chartist: Sheldon
(For the chart screenshot, click here.)
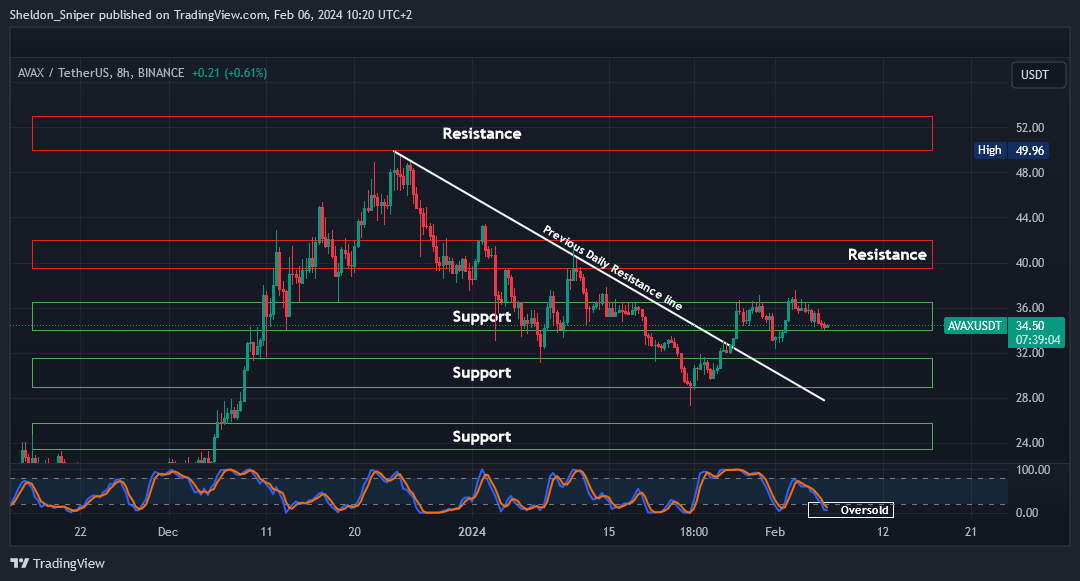
AVAX is consolidating in the $34.40 - $36.20 area of support.
With price being oversold on the 8-hour chart, I’m looking at a spot long trade here, with the intention of taking profit at the next resistance areas, which are between $40.00 - $42.50, and then $50.00 - $53.00.
My stop loss will be just below $30.00.
Sign-up and trade on Bybit today.
Exclusive $30,000 deposit rewards and bonuses up for grabs!
Chart #2 - Bitcoin (BTCUSD) Daily
Chartist: Kyle
(For the chart screenshot, click here.)
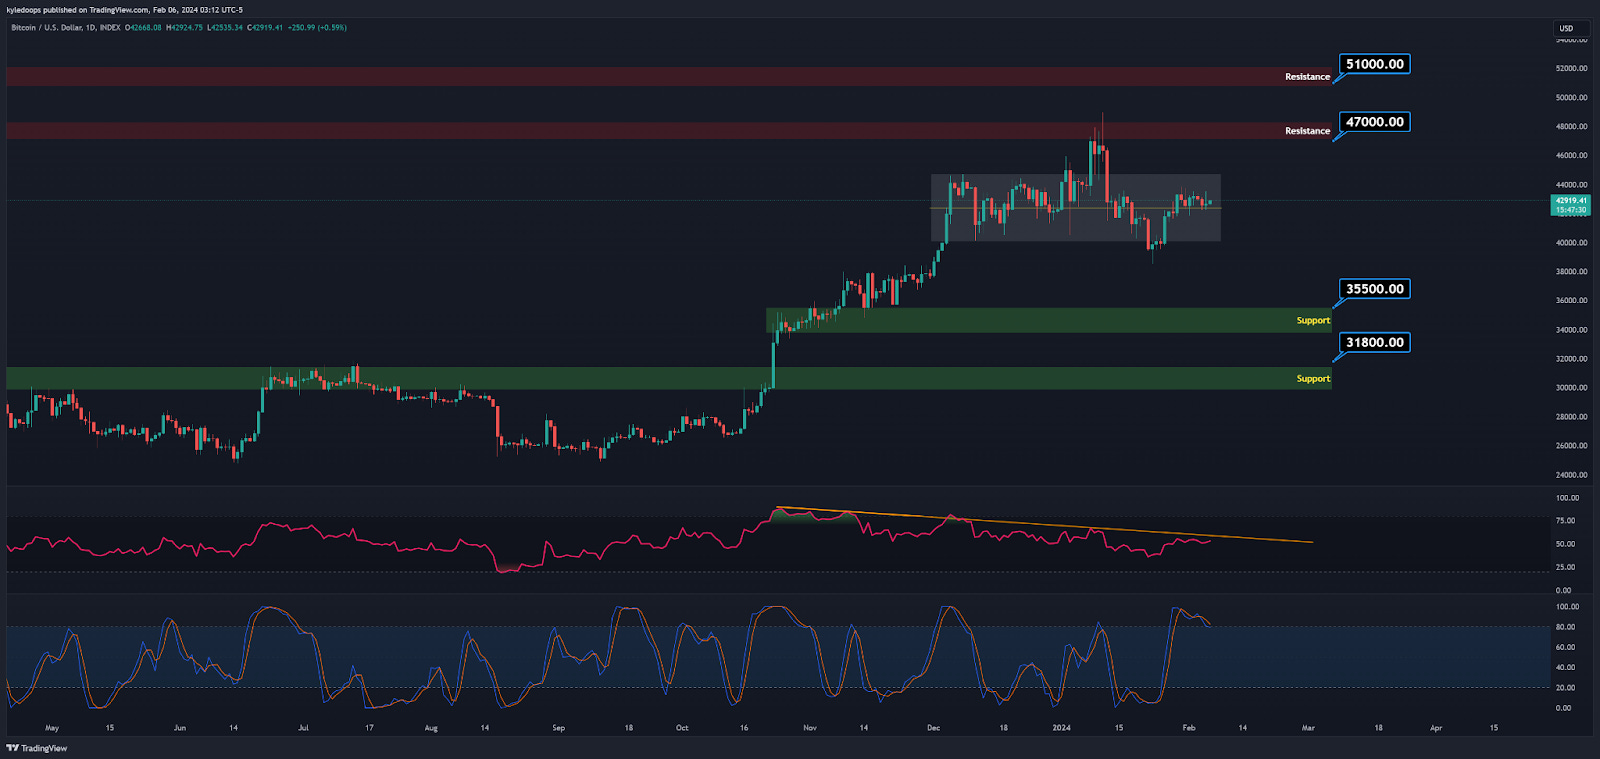
Bitcoin is holding above the 50% mark within its range, forming a consolidative structure that may be giving time for the bulls to gather momentum. However, the RSI has been slowly dropping since last October, consistently printing lower highs.
Currently, neither the bulls nor the bears seem to have a strong presence, as there is low volume and volatility in the market.
To continue its climb, Bitcoin needs to reclaim the 50 daily Moving Average (MA). If it fails to do so, the next support levels to watch are at $37,500, $35,500, and $31,800.
On the other hand, if it starts moving upward, the next target could be at $58,000.
Claim your Bitget sign-up bonuses here (details below).

Outsmart 99% Of The Market!
Get full access into our Discord And Telegram group, where you'll find all of our premium content!
👉 Trade Signals!
👉 Trade Set-Ups!
👉 Trading Challenges!
👉 Education!
👉 SO MUCH MORE!
Chart #3 - Toncoin (TONUSDT) Weekly
Chartist: Kyle
(For the chart screenshot, click here.)
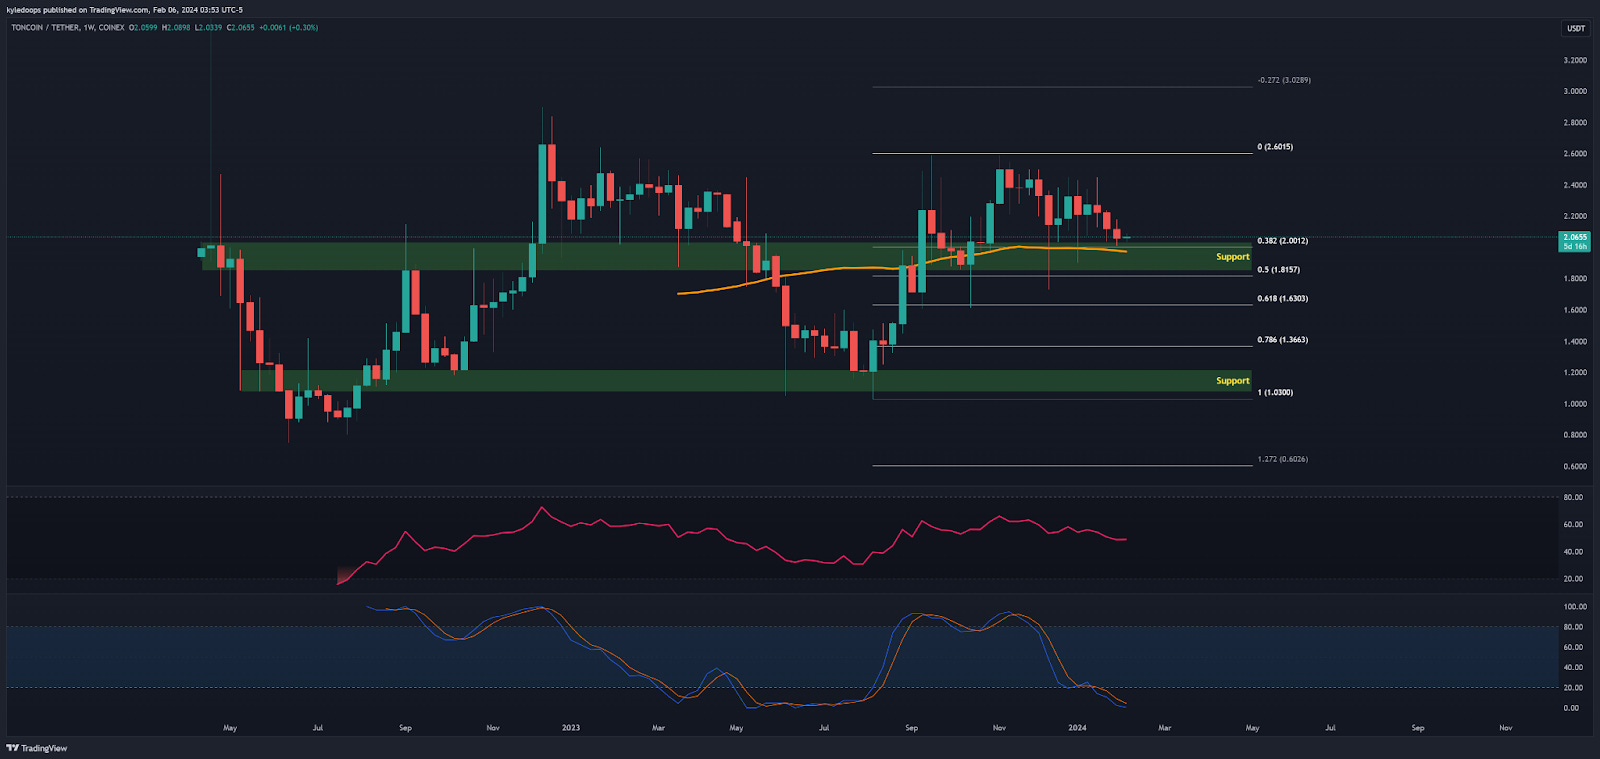
TON on the weekly chart appears to be building structure around support at $2, where the 50MA weekly is located.
The RSI is in oversold territory, though it has not yet triggered a reversal, making it a token to watch closely. If it loses its support, the next point of interest will be in the range of $1.20 to $1.00, which is well within a discount area.
The next resistance level is located once again at $2.60, followed by another one at around $3.50 to $3.80.
You can consider approaching this token using the Dollar-Cost Averaging (DCA) method, establishing a position at this level, and later DCA in any direction it moves to improve your position size.
Claim your Bitget sign-up bonuses here (details below).
Chart #4 - Gala (GALAUSDT) 8-Hour
Chartist: Sheldon
(For the chart screenshot, click here.)
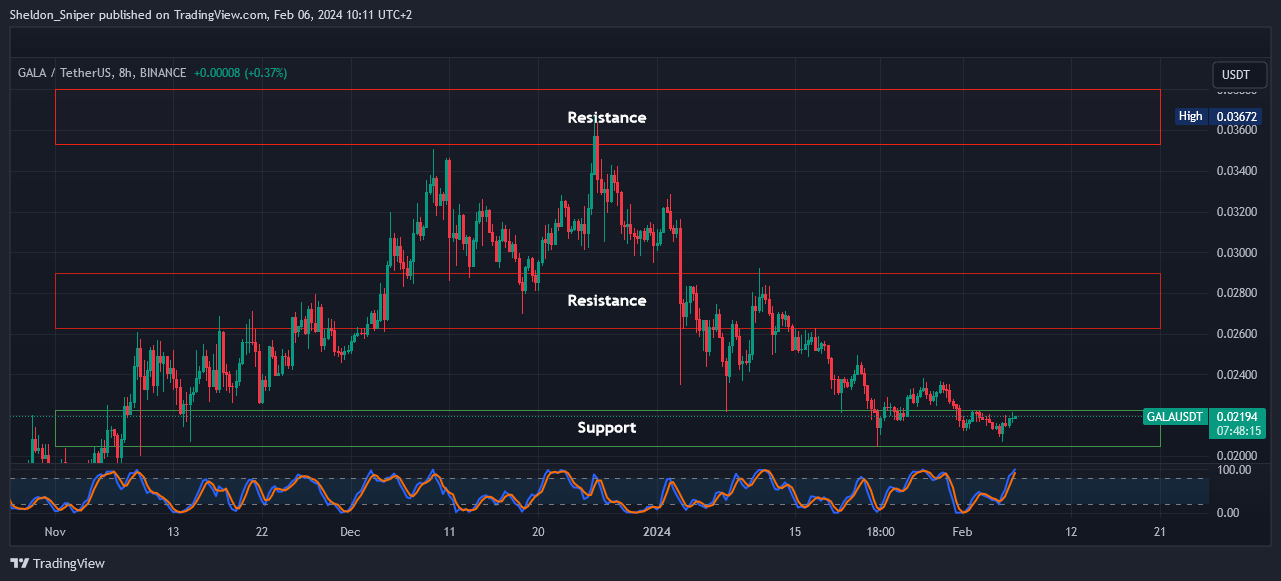
GALA is consolidating within a support area between $0.02050 and $0.02200.
I am currently laddering into a long spot trade, with the intention of taking profit at the next two resistance levels at approximately $0.028 and $0.036.
I have set my stop loss just below $0.02. I believe that the gaming sector is preparing for another rally to the upside, and GALA has the potential to move quickly if gaming experiences a strong run.
Claim your Bitget sign-up bonuses here (details below).
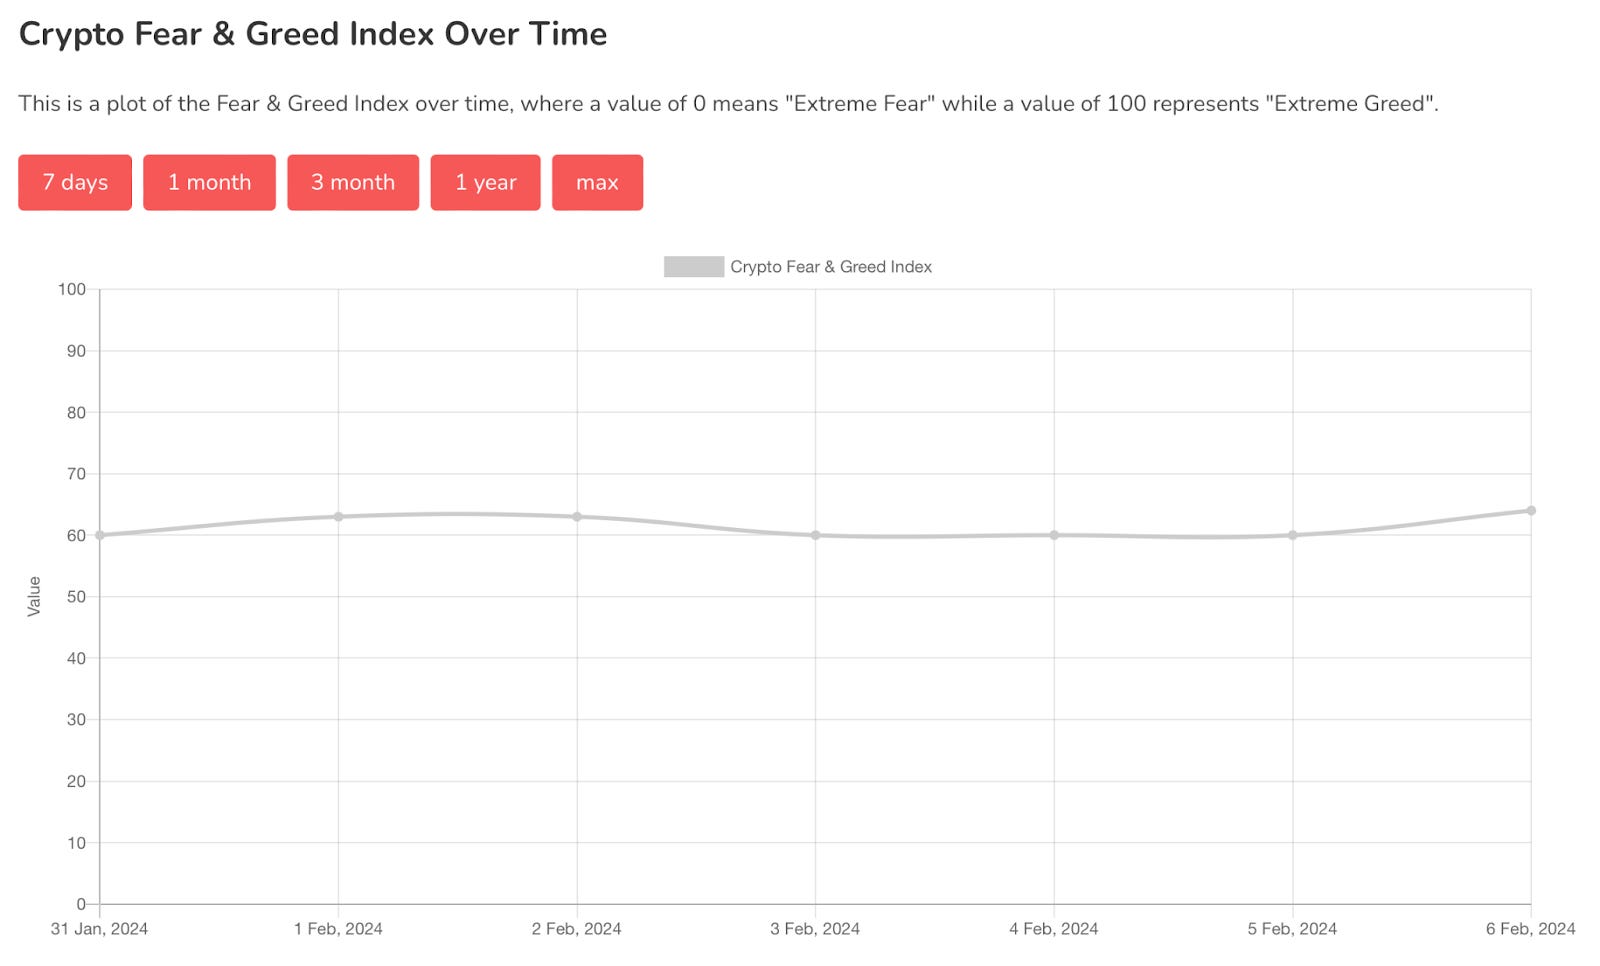
Chart #5 - Fear and Greed Index
The Fear and Greed Index is sitting at 64 today, indicating Greed.
The highest the index has been over the past seven days is 64, and the lowest is 60.
Banter’s Take
Bitcoin is not showing a clear trend right now, but Ethereum against Bitcoin has started to show a shift. Opportunities within the Ethereum ecosystem are emerging, so it's important not to overlook projects like LINK, AAVE, SOL, AVAX, SUI, ROSE, and TRX.
Stay safe my friends!
Go to our Crypto Banter Discord here where Sheldon and Kyle give updates on the charts and trades from The Daily Candle newsletter!