

📈📉 Two BTC Trades You Can’t Miss!

Overview
Chart #1 - Ethereum (ETHUSDT) Daily Chart
Chart #2 - Bitcoin (BTCUSD) Daily Chart
Chart #3 - S&P 500 (ES1!) Daily Chart
Chart #4 - Cardano (ADAUSDT) Daily Chart
Chart #5 - Fear and Greed Index

Chart #1 - Ethereum (ETHUSDT) Daily Chart
Chartist: Sheldon
(For the chart screenshot, click here.)
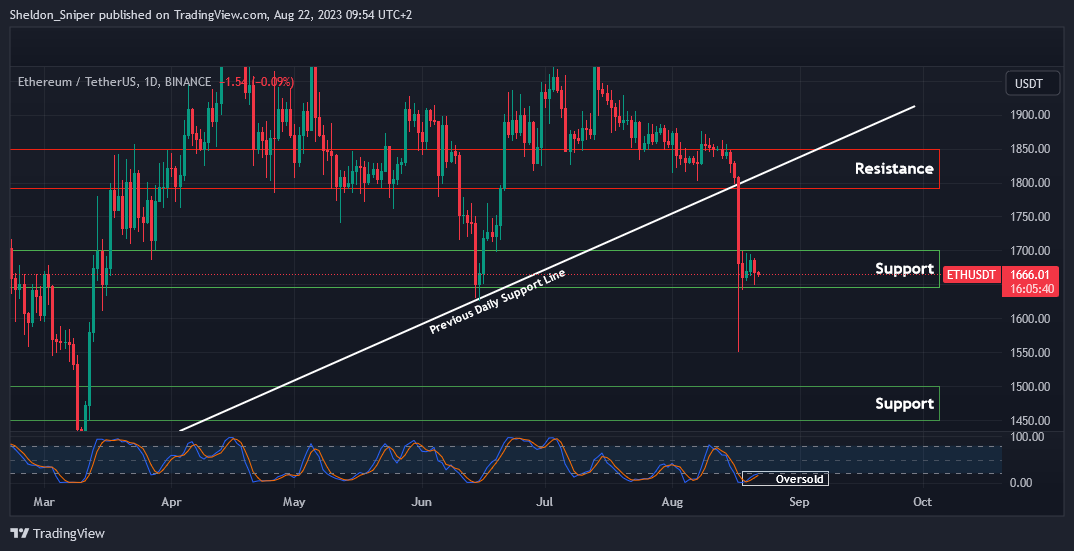
Last Thursday, ETH dropped from around $1,800 to $1,550 in a single day, due to fears of the BTC ETF not being launched anytime soon.
ETH has recovered, currently ranging in the $1,650 - $1,700 area of support. It is also very much oversold on the daily time frame. I expect it to now test the resistance at $1,750, then the major $1,800 - $1,850 area of resistance, which held as support for most of the past four months.
The previous daily ascending support line, coming from the beginning of the year, is also intersecting in the $1,800 area and will now act as additional resistance in that area. To the downside, if the $1,600 support level is lost, then the next level of support is at $1,550, with the next major area of support at $1,450 - $1,500.
Sign-up and trade on Bybit today.
Exclusive $30,000 deposit rewards and bonuses up for grabs!
Chart #2 - Bitcoin (BTCUSD) Daily Chart
Chartist: Kyle
(For the chart screenshot, click here.)
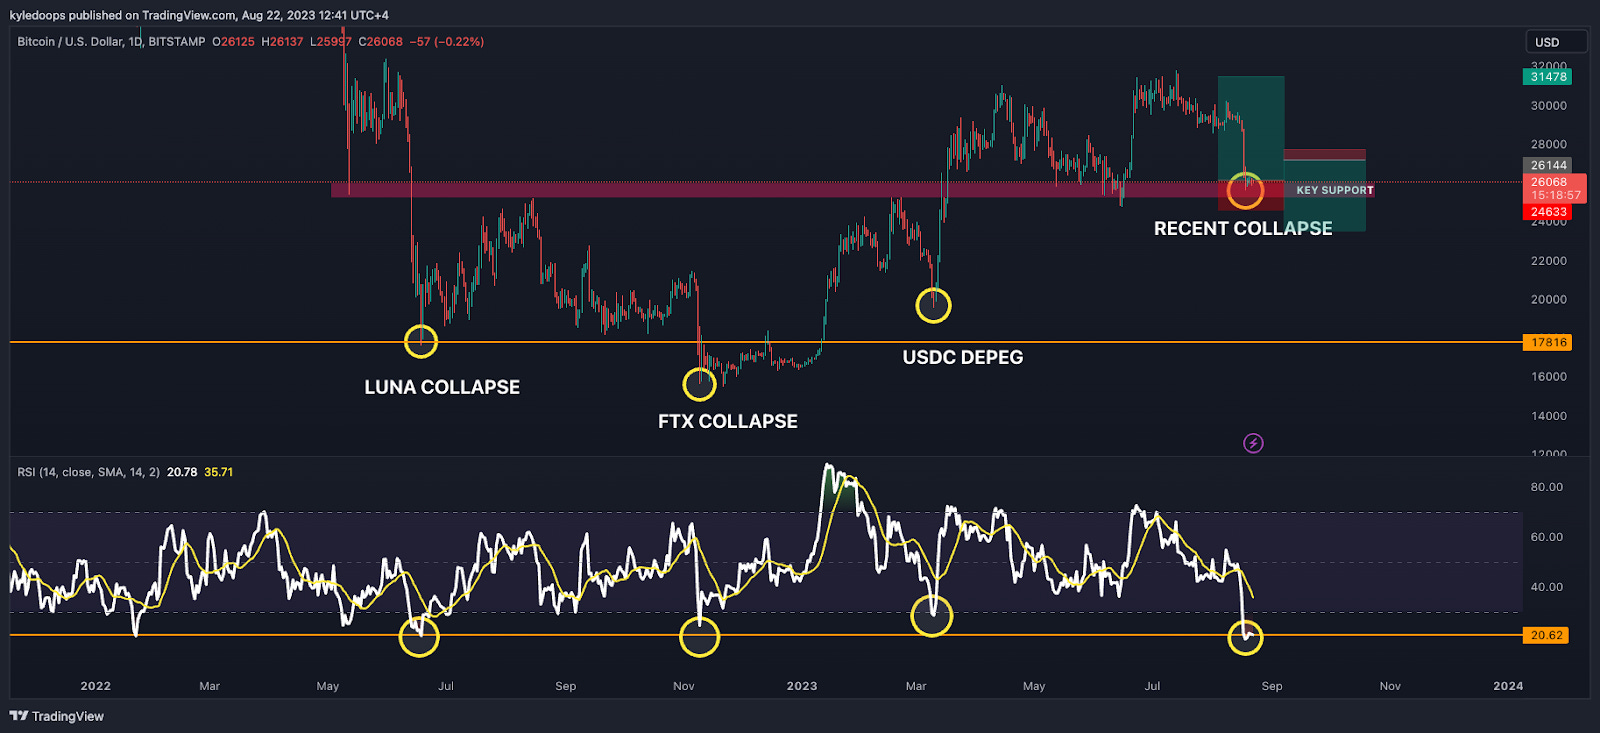
This is the lowest RSI reading we've seen in over a year.
It's lower than the Luna collapse, the FTX collapse, and the USDC depeg. This means that if Bitcoin regains pivotal levels and rebounds, this could be a major low, as observed in previous instances.
Based on this, I would initiate two trades:
The first would be a long position with stops set below the prior lows; the pink box indicates key support. The take-profit target would be set towards the range highs.
The second trade would be a short position, taken only if I observe weakness and rejection from the $27,200 mark. This would act as a hedge against the long trade. For this trade, the take-profit target would be set at the next critical support level of $23,500.
𝗣𝗿𝗶𝗺𝗲 𝗫𝗕𝗧
Sign up for a new Trading Account on Prime XBT!
Receive a deposit bonus of up to $7,000 with promo code: KyleDoops
Chart #3 - S&P 500 (ES1!) Daily Chart
Chartist: Kyle
(For the chart screenshot, click here.)
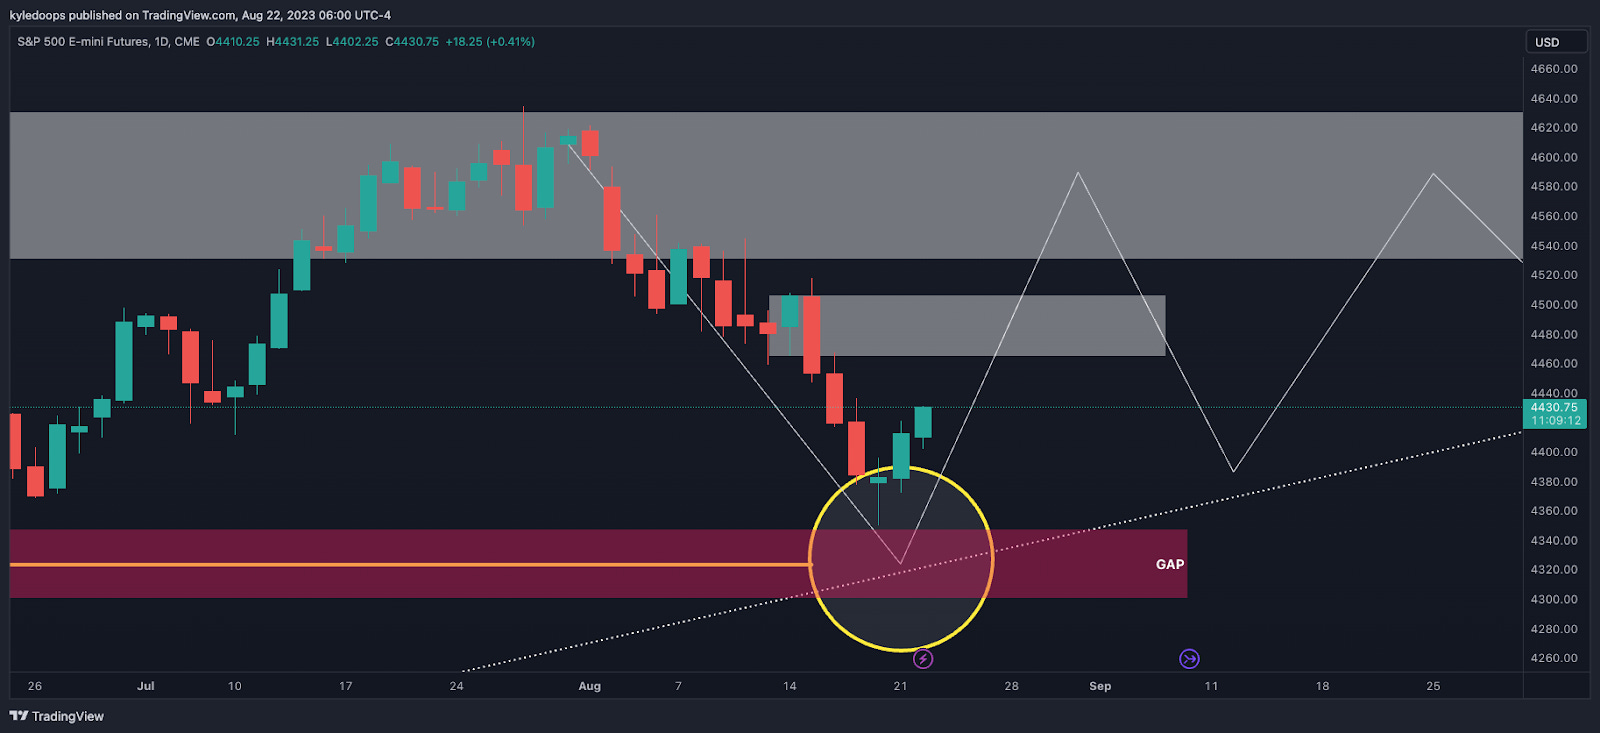
Demand for the S&P 500 was met in the previously outlined region, with the price bouncing from the highlighted circled area.
The next resistance is anticipated at 4,460 - 4,500. If the price breaks through that level, the next target is 4,600.
The price may oscillate within this region, potentially forming an ascending triangle, with a possibility of breaking out later this year.
Claim your Bitget sign-up bonuses here (details below).
Chart #4 - Cardano (ADAUSDT) Daily Chart
Chartist: Sheldon

(For the chart screenshot, click here.)
Last week, ADA tested $0.24, a level previously touched in June. The price has seen a slight recovery and is now trading just above $0.26.
I anticipate ADA to rise again and challenge last week’s breakdown. That lies between $0.28 - $0.30.
Should crypto pull back further and ADA's price descends, the next support zone would be between $0.24 - $0.25.
Claim your Bitget sign-up bonuses here (details below).
Chart #5 - Fear and Greed Index
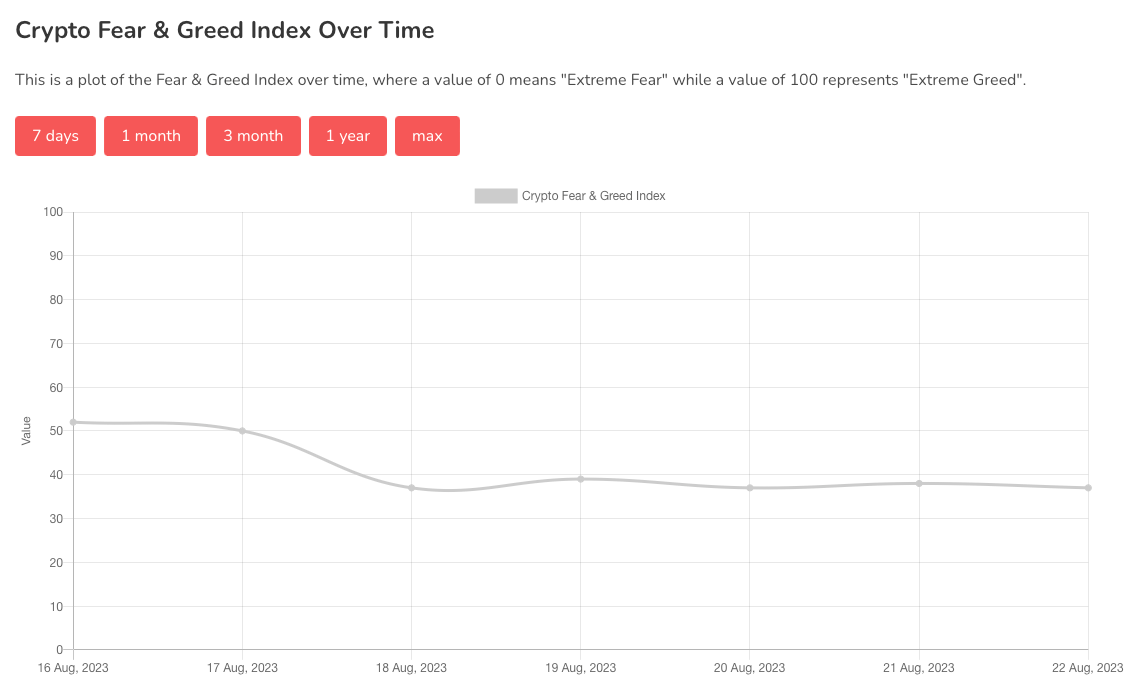
The Fear and Greed Index is sitting at 37 today, indicating Fear.
The highest the index has been over the past seven days is 52, and the lowest is 37.
Banter’s Take
Bitcoin is once again moving in a distinctly diagonal pattern. The ranges remain consistent with what was outlined yesterday. I'm awaiting a sweep to either $25,235 or $27,000 before initiating a trade.
Stay safe my friends!
Go to our Crypto Banter Discord here where Sheldon and Kyle give updates on the charts and trades from The Daily Candle newsletter!