

📈📉 UOS and APEX Trade Setups!
📈📉 UOS and APEX Trade Setups!
Altcoin Longs Depend on Whether Bitcoin Holds Up!
Overview
Chart #1 - Solana (SOLUSDT) 3-Day
Chart #2 - Ultra (UOSUSDT) Daily
Chart #3 - ApeX (APEXUSDT) Daily
Chart #4 - Crypto Total Market Cap (TOTAL) 3-Day
Chart #5 - Fear and Greed Index
Chart #1 - Solana (SOLUSDT) 3-Day
Chartist: Sheldon

(For the chart screenshot, click here.)
SOL is trading within the $57 - $60 support zone, which has been strong over the past week.
There are noticeable wicks on both the upper and lower sides, showing quick buying activity following any dips. Meanwhile, BTC is in a sideways trend, so the future direction is uncertain.
For SOL, it's crucial to be ready for movement in either direction. If the price continues to rise, the next resistance zone is around $74 - $78, where increased selling pressure is likely. And, if SOL drops below the $57 support, the next support levels are at $48 - $51, and then at $37 - $39.
Sign-up and trade on Bybit today.
Exclusive $30,000 deposit rewards and bonuses up for grabs!
Chart #2 - Ultra (UOSUSDT) Daily
Chartist: Kyle
(For the chart screenshot, click here.)
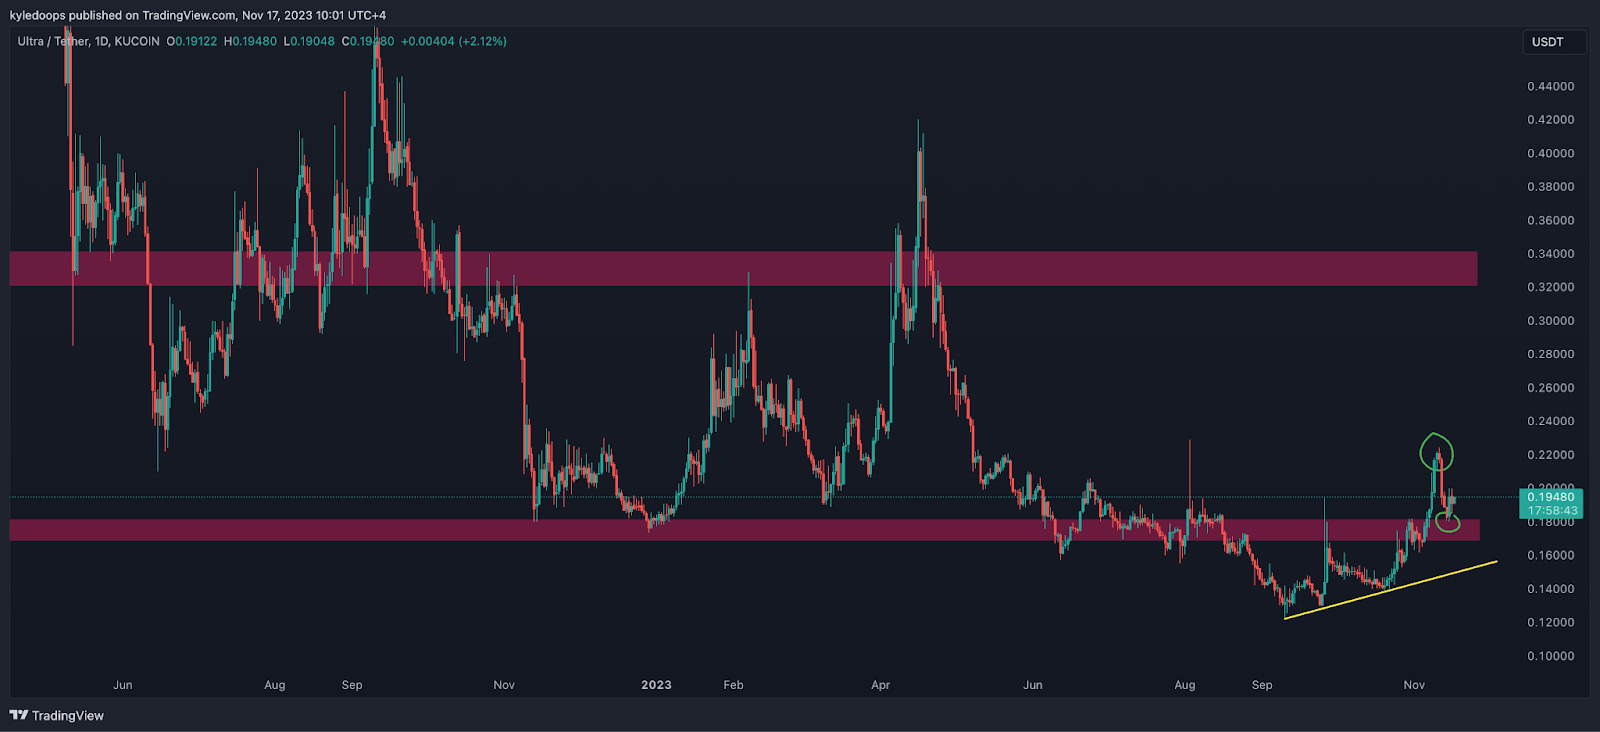
Ultra has achieved a new high for the first time in a long while, followed by forming a higher low at $0.18, while also forming this higher low at the point of reclaiming the range low.
This presents a great trading opportunity to go long and anticipate higher prices in the upcoming days.
The stop-loss would be set just below $0.16.
Claim your Bitget sign-up bonuses here (details below).

Outsmart 99% Of The Market!
Get full access into our Discord And Telegram group, where you'll find all of our premium content!
👉 Trade Signals!
👉 Trade Set-Ups!
👉 Trading Challenges!
👉 Education!
👉 SO MUCH MORE!
Chart #3 - ApeX (APEXUSDT) Daily
Chartist: Kyle
(For the chart screenshot, click here.)
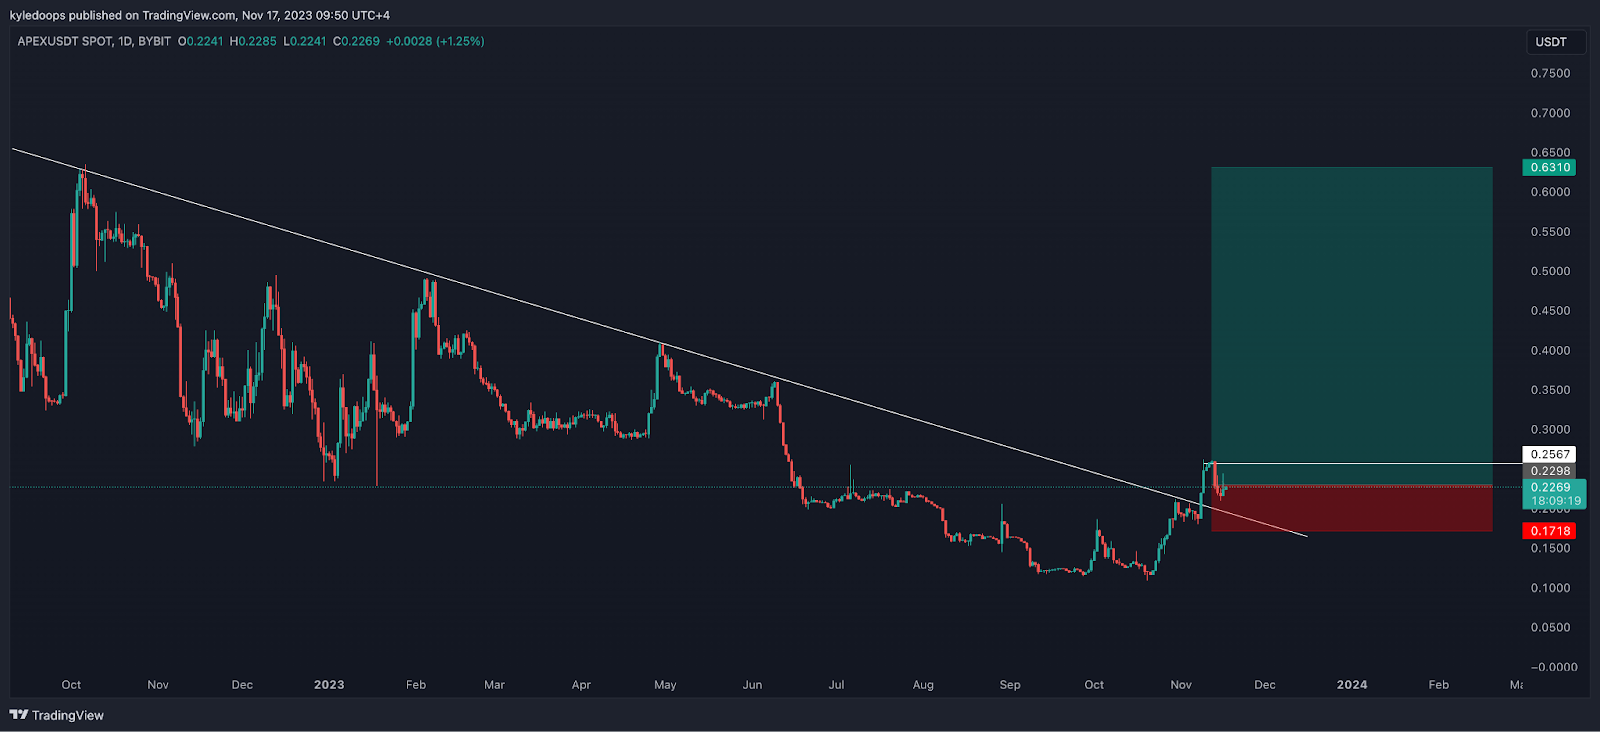
ApeX is breaking out of a long-term downtrend by forming both a higher high and a higher low.
The strategy would involve placing a stop-loss at $0.17, entering the market at the current price, and setting a Take Profit (TP) target at $0.63
Claim your Bitget sign-up bonuses here (details below).
Chart #4 - Crypto Total Market Cap (TOTAL) 3-Day
Chartist: Sheldon

(For the chart screenshot, click here.)
Over the past week, the TOTAL has been fluctuating within a range, finding support at approximately $1.32 trillion and facing resistance near $1.42 trillion.
The market's future direction remains uncertain, but traders are closely monitoring the anticipated news regarding the launch of the Blackrock ETF, which currently seems to be a key factor supporting the market.
Should the TOTAL successfully breach the $1.4T - $1.45T zone, we could see it approaching the next significant resistance level around $1.5 trillion. On the other hand, a fall below the current support level of $1.32 trillion might lead to a test of the subsequent support range between $1.25 trillion and $1.27 trillion.
Claim your Bitget sign-up bonuses here (details below).
Chart #5 - Fear and Greed Index
The Fear and Greed Index is sitting at 63 today, indicating Greed.
The highest the index has been over the past seven days is 73, and the lowest is 60.

Banter’s Take
All altcoin longs totally depend on whether Bitcoin holds up, and whether the TOTAL3 continues to break out. Following big moves like we’ve recently seen means it’s not out of the question to see either a consolidation or a pullback.
Stay safe my friends!
Go to our Crypto Banter Discord here where Sheldon and Kyle give updates on the charts and trades from The Daily Candle newsletter!