

📈📉 WARNING: BTC Could Easily Drop to $32K!
📈📉 WARNING: BTC Could Easily Drop to $32K!
The market is on a knife's edge with everything dependent on this level!
Overview
Chart #1 - Avalanche (AVAXUSDT) Daily
Chart #2 - Bitcoin (BTCUSD) Daily
Chart #3 - Crypto Total Market Cap Excluding BTC and ETH (TOTAL3) Daily
Chart #4 - Crypto Total Market Cap (TOTAL) 3-Day
Chart #5 - Fear and Greed Index
Chart #1 - Avalanche (AVAXUSDT) Daily
Chartist: Sheldon
(For the chart screenshot, click here.)
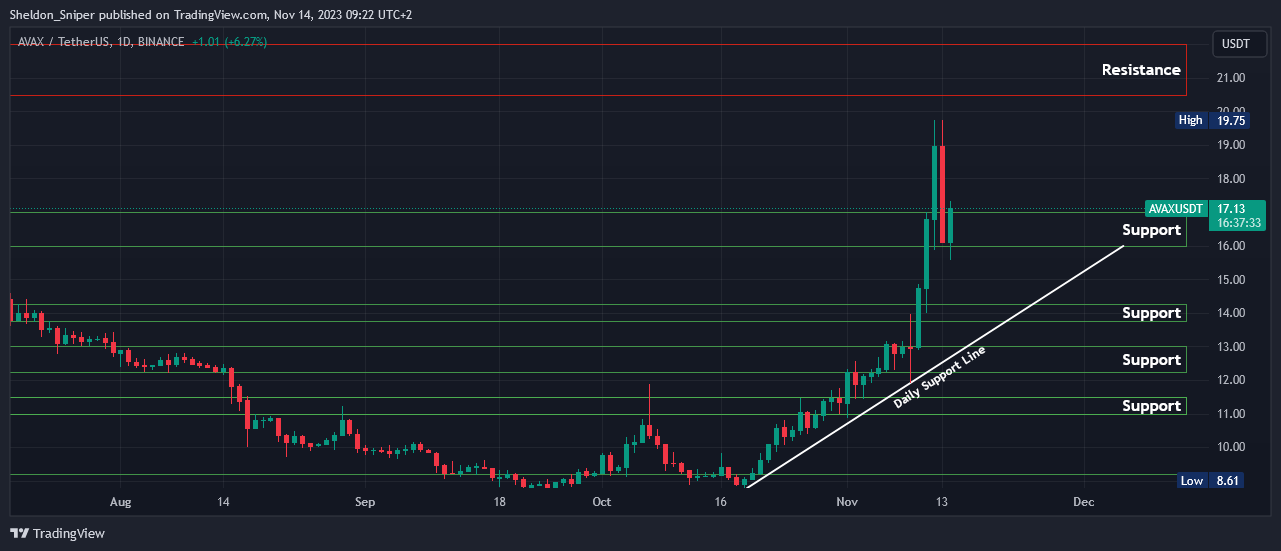
After a couple of weeks of massive upside forAVAX, yesterday we saw the price getting rejected at around $19.75, where it then retraced down to around $15.50 earlier this morning before reversing back up once again.
I think that there is a little more upside, before further downside later in the week.
Currently it’s at $17.00, and in the $16.00 - $17.00 area of support. If this area breaks in the next few days, AVAX will likely head to $13.80 - $14.25 (but a healthy reversal could be good for it).
If it moves higher from here, it should head to $20.50 - $22.00.
Sign-up and trade on Bybit today.
Exclusive $30,000 deposit rewards and bonuses up for grabs!
Chart #2 - Bitcoin (BTCUSD) Daily
Chartist: Kyle
(For the chart screenshot, click here.)
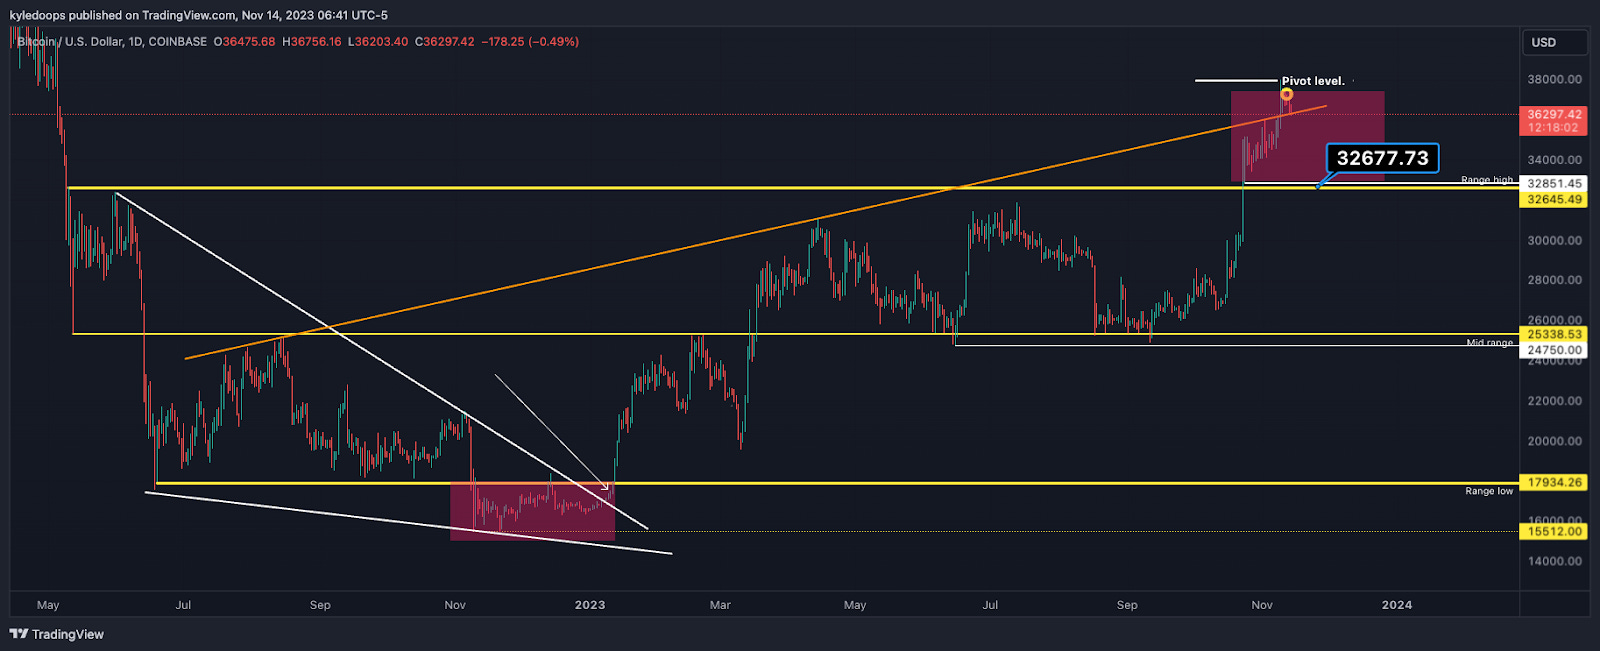
Bitcoin has lost its pivot level and is losing the orange trend line, which it broke above; this trend line governed all the major tops for this entire run-up.
With bearish divergence on the daily now playing out, and a lot of stop losses below price, there could easily be a drop down to $32,000.
That would be Bitcoin's next major support.
If Bitcoin loses that level, much lower prices are likely, as the price will be deviating back into the range, which means we’d need to start trading it like a range again.
Claim your Bitget sign-up bonuses here (details below).

Outsmart 99% Of The Market!
Get full access into our Discord And Telegram group, where you'll find all of our premium content!
👉 Trade Signals!
👉 Trade Set-Ups!
👉 Trading Challenges!
👉 Education!
👉 SO MUCH MORE!
Chart #3 - Crypto Total Market Cap Excluding BTC and ETH (TOTAL3) Daily
Chartist: Kyle
(For the chart screenshot, click here.)
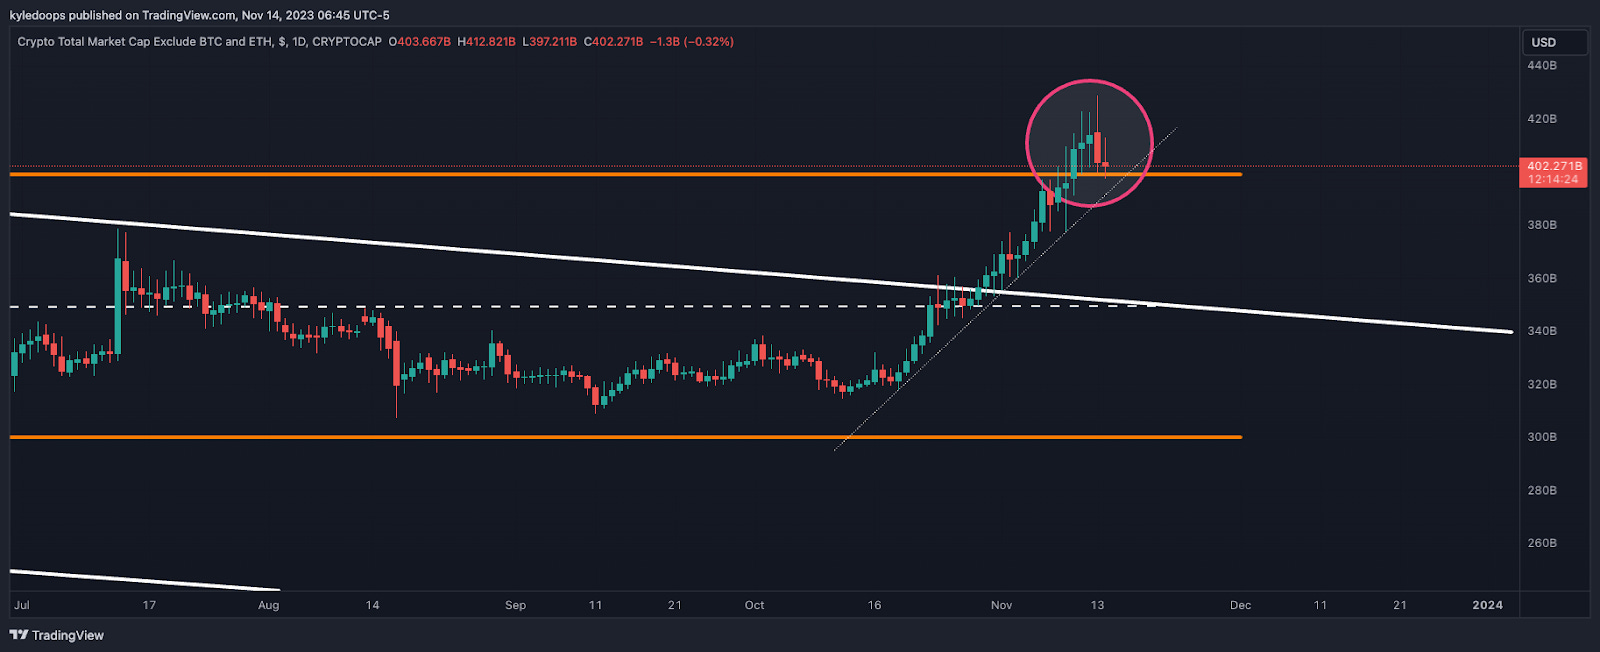
The TOTAL3 is testing the range high, which it broke out of; this is a key level that must hold.
A break below this will mean the TOTAL3 is losing the uptrend, and likely heads a lot lower, possibly back down to the range lows.
The alternative is that it holds as support, confirming the breakout is in fact real, and then the price can start to head towards higher levels in the coming days.
Claim your Bitget sign-up bonuses here (details below).
Chart #4 - Crypto Total Market Cap (TOTAL) 3-Day
Chartist: Sheldon
(For the chart screenshot, click here.)
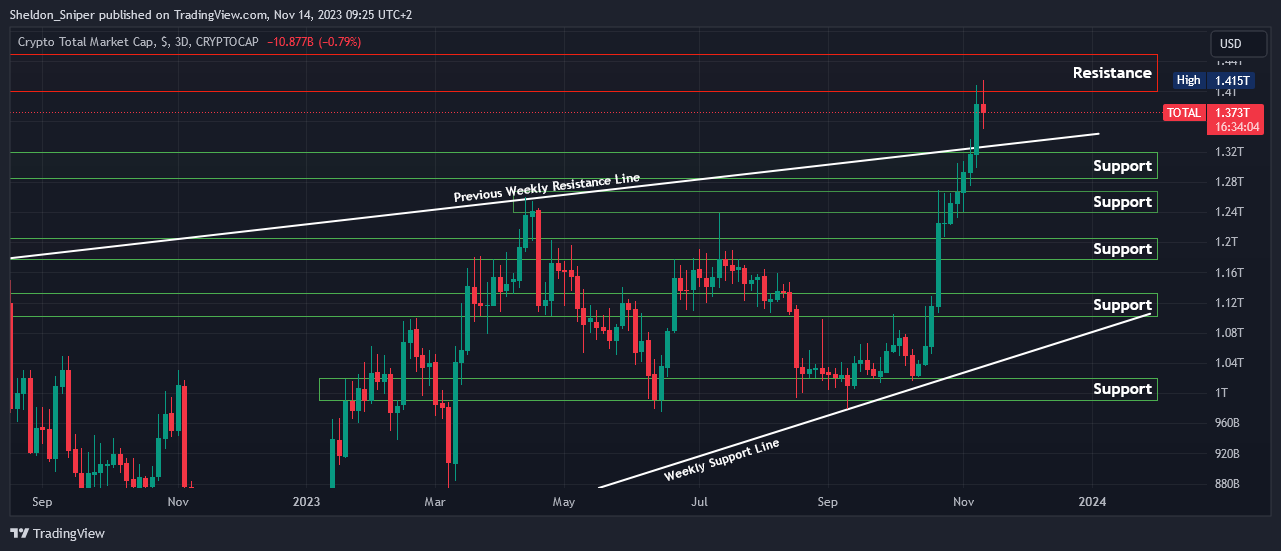
Yesterday we saw the TOTAL reverse off the $1.41T - $1.44T area of resistance and retrace to $1.37T.
It could hang around in this area for the next day or two before further downside.
The next area of support is at $1.28T - $1.32T, the previous weekly resistance line. If that doesn’t hold, the next area of support is at $1.24T - $1.26T.
Claim your Bitget sign-up bonuses here (details below).
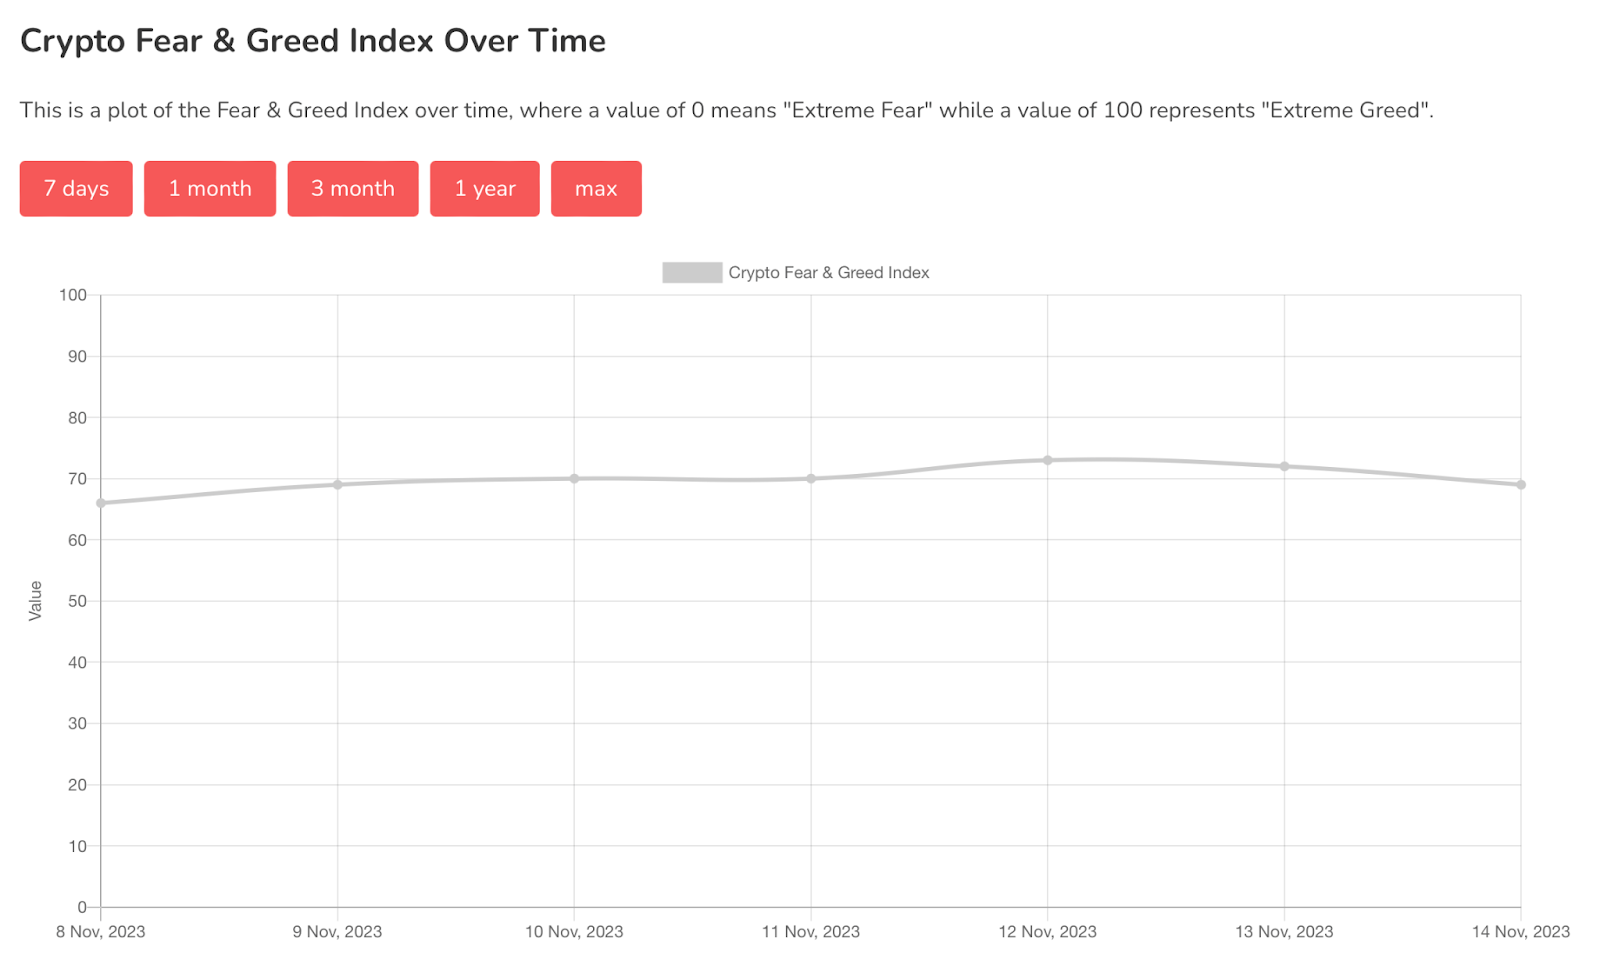
Chart #5 - Fear and Greed Index
The Fear and Greed Index is sitting at 69 today, indicating Greed.
The highest the index has been over the past seven days is 73, and the lowest is 66.
Banter’s Take
The market is on a knife's edge, with everything dependent on Bitcoin's $36,200 level holding. Losing that could easily lead Bitcoin down to $32,000.
Stay safe my friends!
Go to our Crypto Banter Discord here where Sheldon and Kyle give updates on the charts and trades from The Daily Candle newsletter!