

📈📉 WARNING! This Could Invalidate Our ETH Trade!
📈📉 WARNING! This Could Invalidate Our ETH Trade!

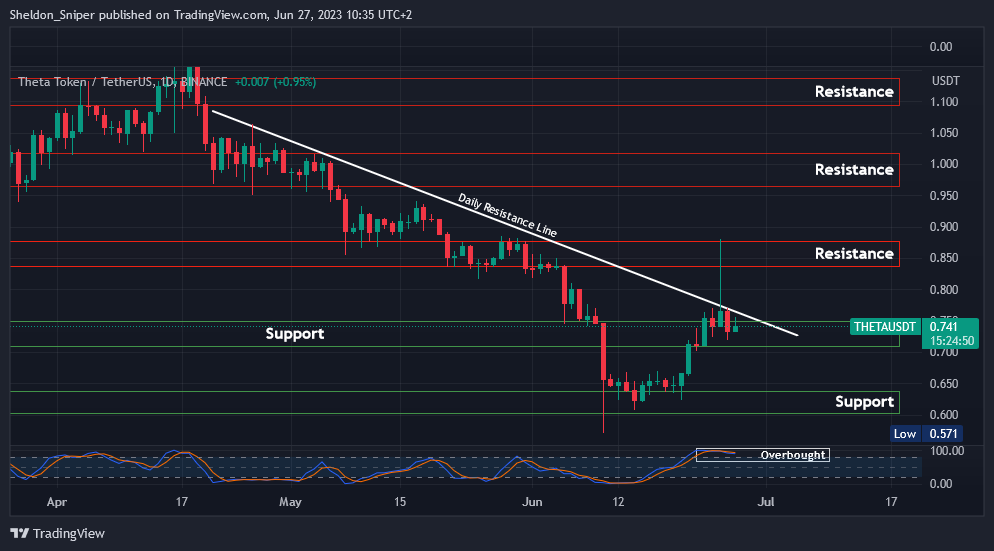
Chart #1 - Theta Network (THETAUSDT) 1-Day Chart
Chartist: Sheldon
(For the chart screenshot, click here.)
After ranging in the $0.60 - $0.64 support area in mid-June, THETA reversed its trend and rallied alongside the rest of the crypto market, peaking at $0.88 this past Sunday. At that point, the price was rejected at the $0.84 - $0.88 area of resistance.
The price has since fallen below the descending daily resistance line originating from mid-April and is currently fluctuating in the $0.71 - $0.75 support area. Given that the price is overbought on the daily timeframe, it may continue to range within the current support area. If the current support fails, the next lower support is at $0.60 - $0.64.
Looking at the market, I personally believe we could be witnessing the start, or nearing the beginning, of an Altcoin Season in the next 6 - 8 weeks.
Sign-up and trade on Bybit today.
Exclusive $30,000 deposit rewards and bonuses up for grabs!
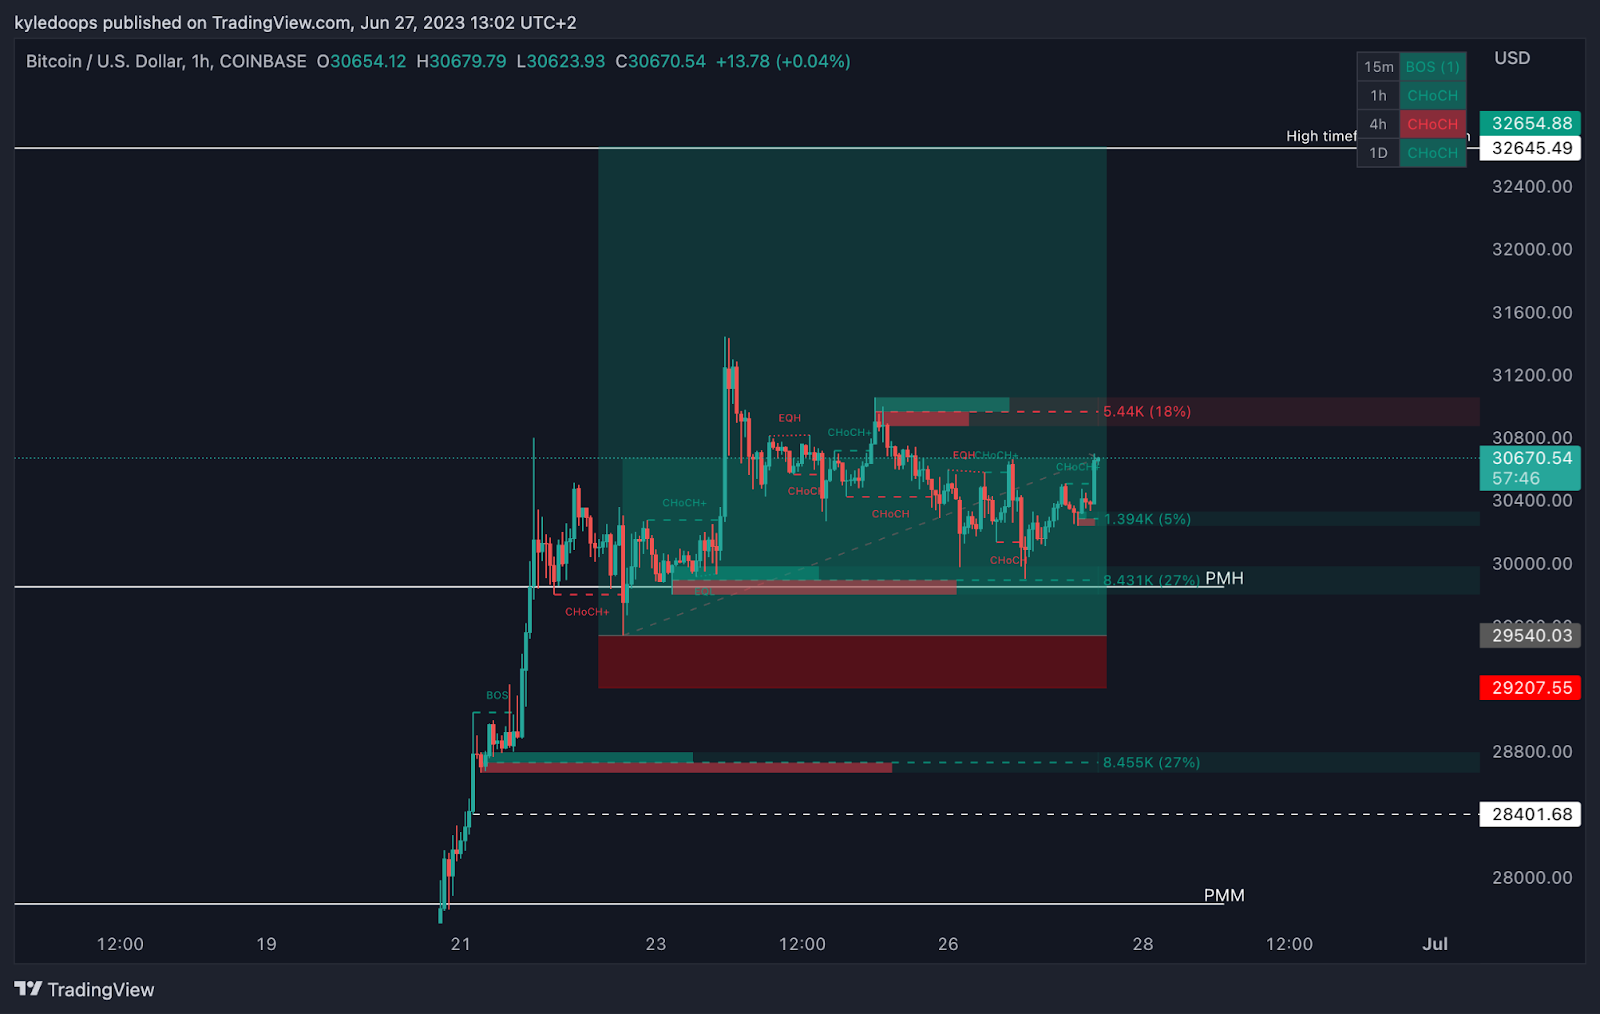
Chart #2 - Bitcoin (BTCUSD) 1-Hour Chart
Chartist: Kyle
(For the chart screenshot, click here.)
A few days ago, we took a long position on Bitcoin, and things are looking good with prices pushing up.
Our final take-profit target remains unchanged at $32,654.
The only adjustment we've made is raising our stop-loss level. The stop is now set at $29,207, positioned just below the wick low from yesterday's red day.
If the bulls intend to push the price higher, they need to act soon.
𝗣𝗿𝗶𝗺𝗲 𝗫𝗕𝗧
Sign up for a new Trading Account on Prime XBT!
Receive a deposit bonus of up to $7,000 with promo code: KyleDoops

Sign up for a new Trading Account on Prime XBT!
Receive a deposit bonus of up to $7,000 with promo code: SheldonSniper
Chart #3 - Ethereum (ETHUSD) 1-Hour Chart
Chartist: Kyle

(For the chart screenshot, click here.)
Just as with BTC, we took a long position on ETH a few days ago and continue to hold it. The take-profit targets remain at $2,022 and $2,144.
Based on the new swing low, the stop-loss has been moved up to just below the swing low wick, positioned at $1,837.74.
Any drop back down to that level though would suggest that bears are likely regaining control, indicating that our long position idea was incorrect.
Claim your Bitget sign-up bonuses here (details below).
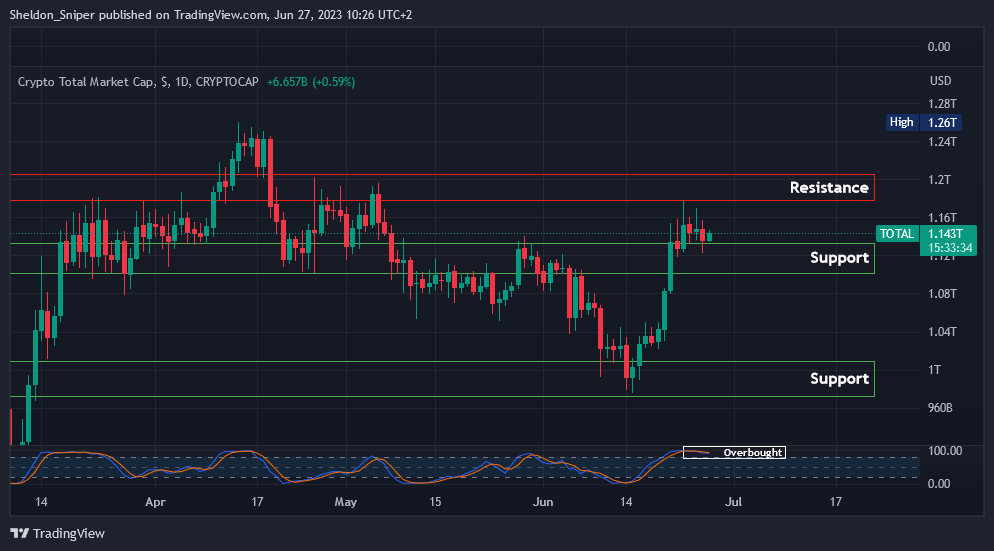
Chart #4 - TOTAL 1-Day Chart
Chartist: Sheldon
(For the chart screenshot, click here.)
The TOTAL is currently ranging in the $1.10T - $1.14T area of support. This follows a massive 20% rally over the past two weeks, where it increased from around $970B to $1.18T.
Last week, it got rejected at the $1.18T - $1.20T area of resistance. With the TOTAL currently overbought on the daily timeframe, it could either continue to range in this current major area of support, or potentially retest the smaller support areas at $1.08T or even $1.04T, over the next few days.
Claim your Bitget sign-up bonuses here (details below).
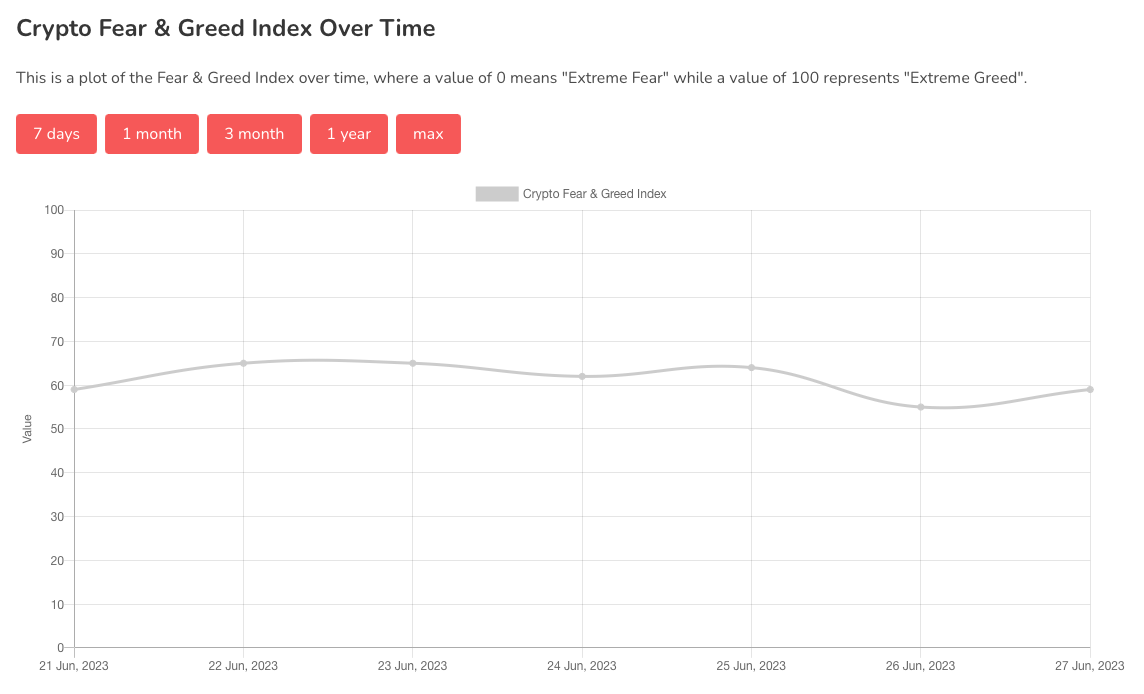
Chart #5 - Bitcoin Fear and Greed Index
The Bitcoin Fear and Greed Index is sitting at 59 today, indicating Greed.
The highest the index has been over the past seven days is 65, and the lowest is 55.
Banter’s Take
If the bulls seize control now and drive the price higher, there's a chance that this month could close as a bullish engulfing candle. That would mean next month is likely a great month with continuation higher.
Stay safe my friends!
Go to our Crypto Banter Discord here where Sheldon and Kyle give updates on the charts and trades from The Daily Candle newsletter!