

📈📉 We Are Going Long on Optimism with a Target of…
📈📉 We Are Going Long on Optimism with a Target of…

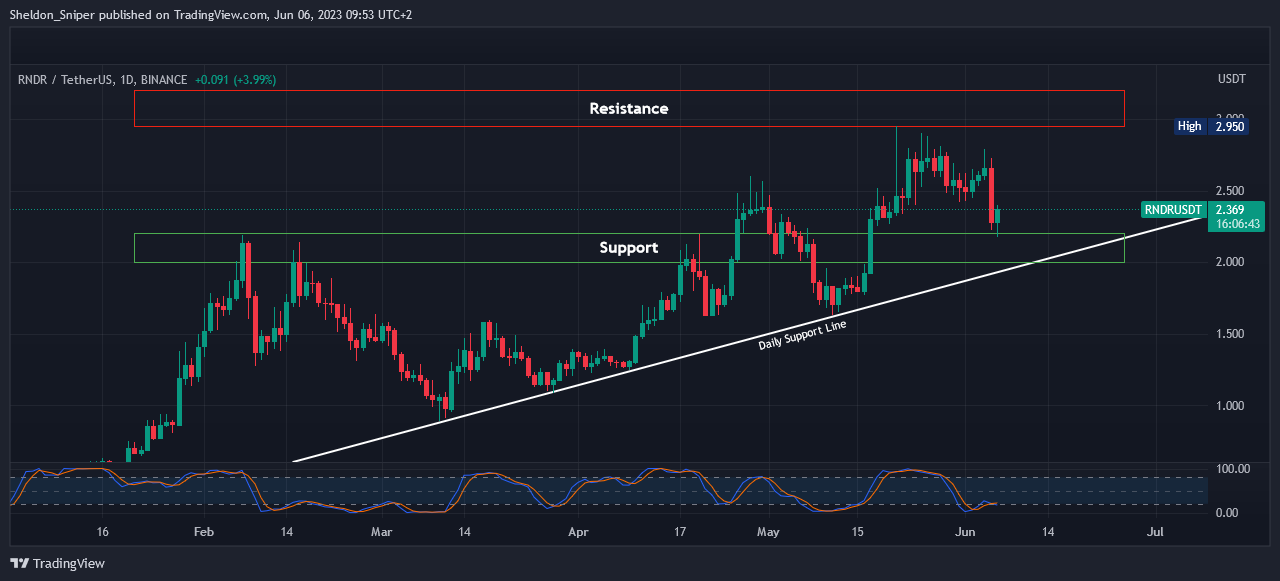
Chart #1 - Render (RNDRUSDT) 1-Day Chart
Chartist: Sheldon
(For the chart screenshot, click here.)
Yesterday, RNDR dropped significantly from around $2.70, down to the $2.00 - $2.20 range, a major area of support. The daily ascending support line, which originates from the beginning of February, is also providing additional support there.
Considering that RNDR has been one of the best-performing altcoins over the last couple of weeks, it could potentially gear up to once again forge the next leg to the upside, provided that the price can stabilize in this area of support.
A rally to the upside could possibly send the price to test the next major resistance level, around $3.00.
𝗣𝗿𝗶𝗺𝗲 𝗫𝗕𝗧
Sign up for a new Trading Account on Prime XBT!
Receive a deposit bonus of up to $7,000 with promo code: SheldonSniper
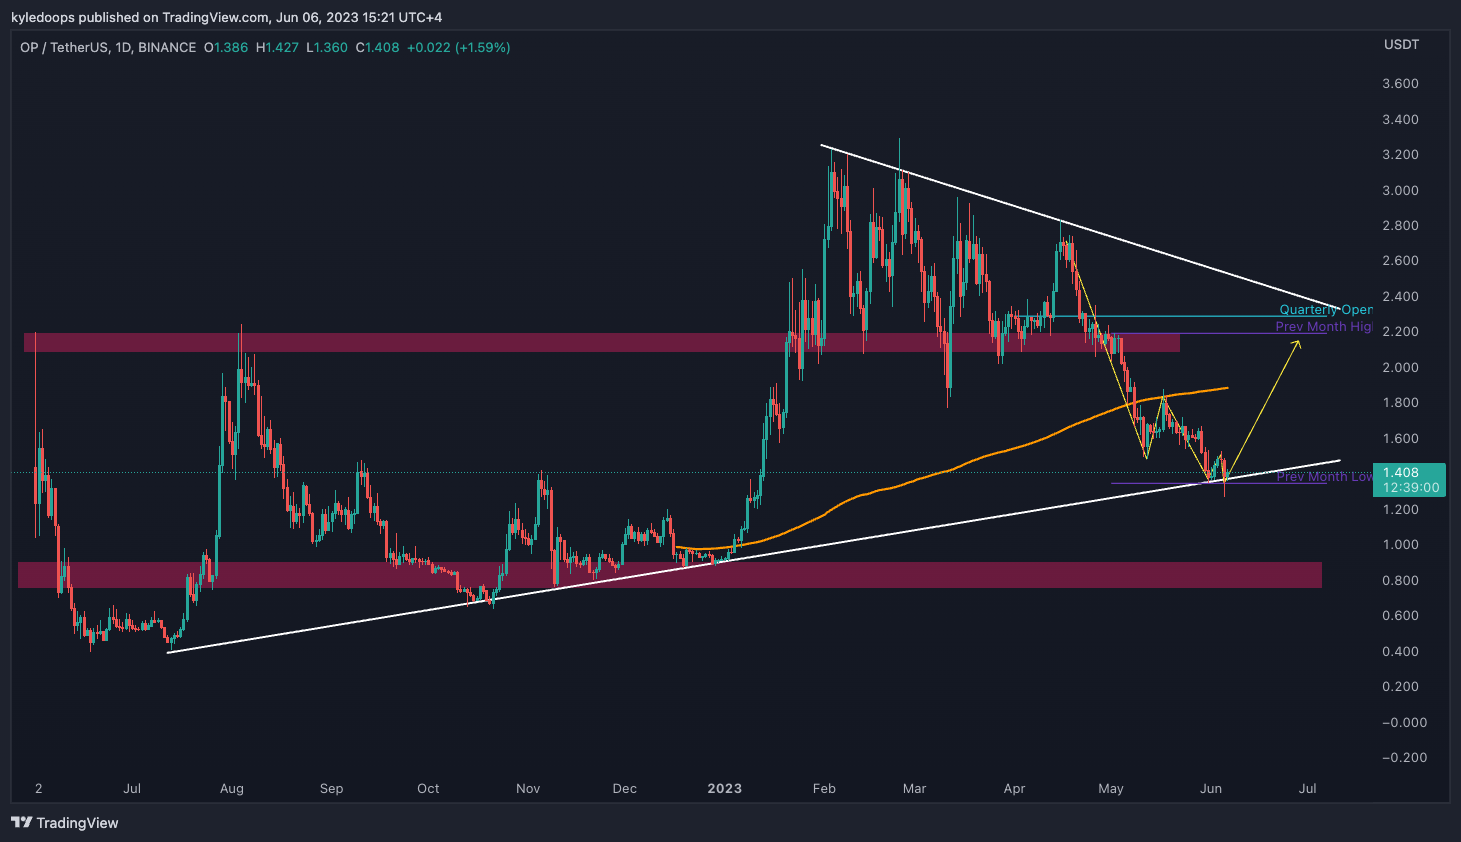
Chart #2 - Optimism (OPUSDT) 1-Day Chart
Chartist: Kyle
(For the chart screenshot, click here.)
OP bounced off the previous month's low, as well as the long-term diagonal trend line at $1.40. This would be as good a place as any to establish a long position since it's also at the mid-range.
I would anticipate the bounce to drive the price towards the previous month's high at $2.20, which also aligns with the range high.
Losing this support would invalidate the long position idea, likely causing the price to return to $0.80.
𝗣𝗿𝗶𝗺𝗲 𝗫𝗕𝗧
Sign up for a new Trading Account on Prime XBT!
Receive a deposit bonus of up to $7,000 with promo code: KyleDoops
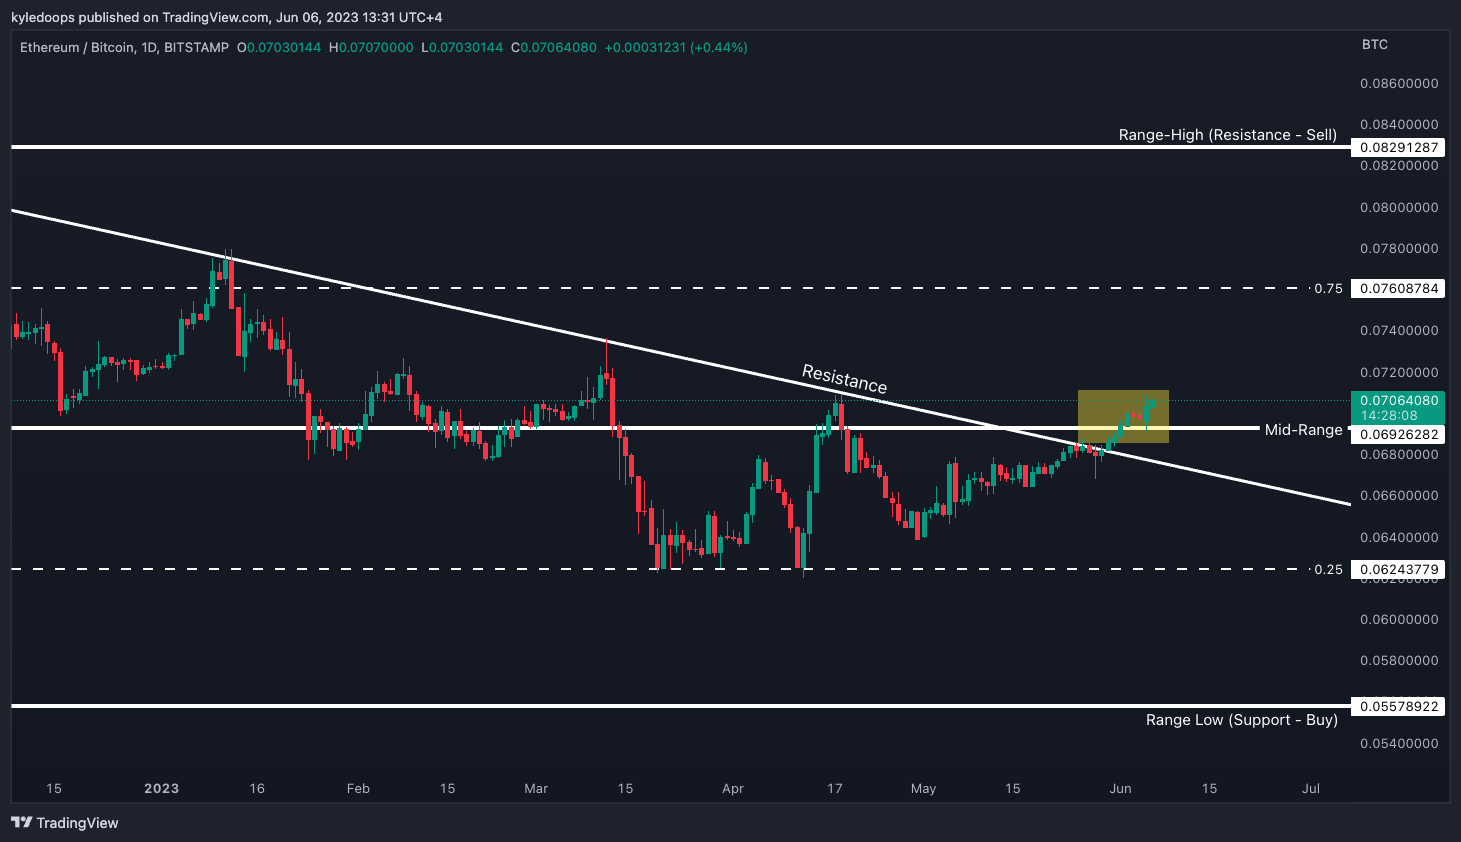
Chart #3 - Ethereum/Bitcoin (ETHBTC) 1-Day Chart
Chartist: Kyle
(For the chart screenshot, click here.)
ETH continues to show relative strength against BTC, as it has broken above the mid-range level and the long-term diagonal. As long as it sustains above 0.069, ETH is likely to continue this trend.
The next target would be the 75% level of the range, which stands at 0.076.
Claim your Bitget sign-up bonuses here (details below).
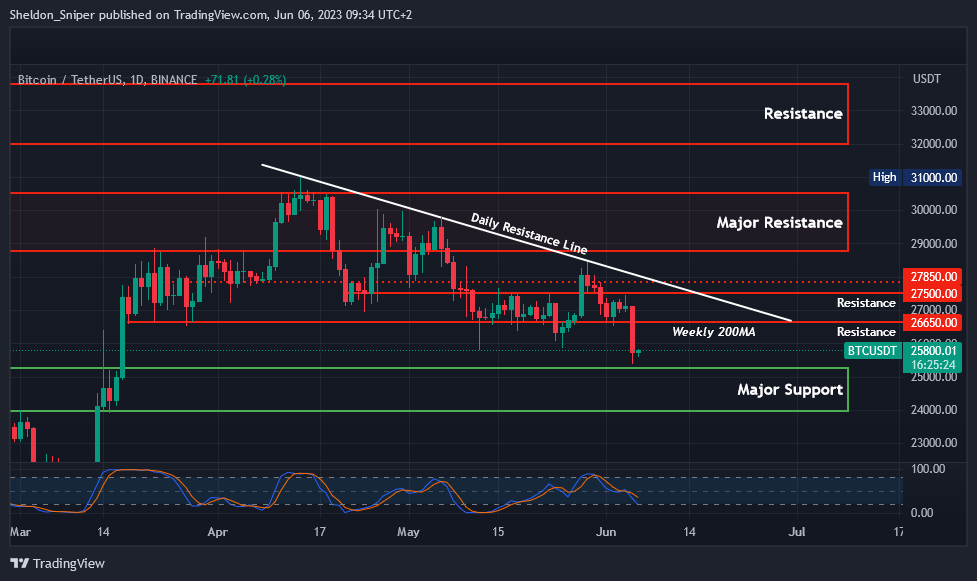
Chart #4 - Bitcoin (BTCUSDT) 1-Day Chart
Chartist: Sheldon
(For the chart screenshot, click here.)
Yesterday, we witnessed a massive drop in the crypto market following the news that the SEC was suing Binance.
BTC's price dropped 6.3% for the day, falling from around $27,125 to $25,400 by late afternoon. Additionally, BTC broke through two critical levels of support: the $26,650 mark and the 200 Weekly Moving Average at around $26,500, which has held since mid-March. BTC is currently trading at the top of a major support area ranging from $23,800 to $25,300.
It's still too early to determine whether the price will stabilize in this area. However, if the price drops further, we could potentially see a test of the bottom of the support range around $23,800 - $24,000.
A move to the upside, could take BTC up to test the 200 weekly Moving Average at $26,500, or even $26,650, levels which will now be acting as resistance.
Claim your Bitget sign-up bonuses here (details below).
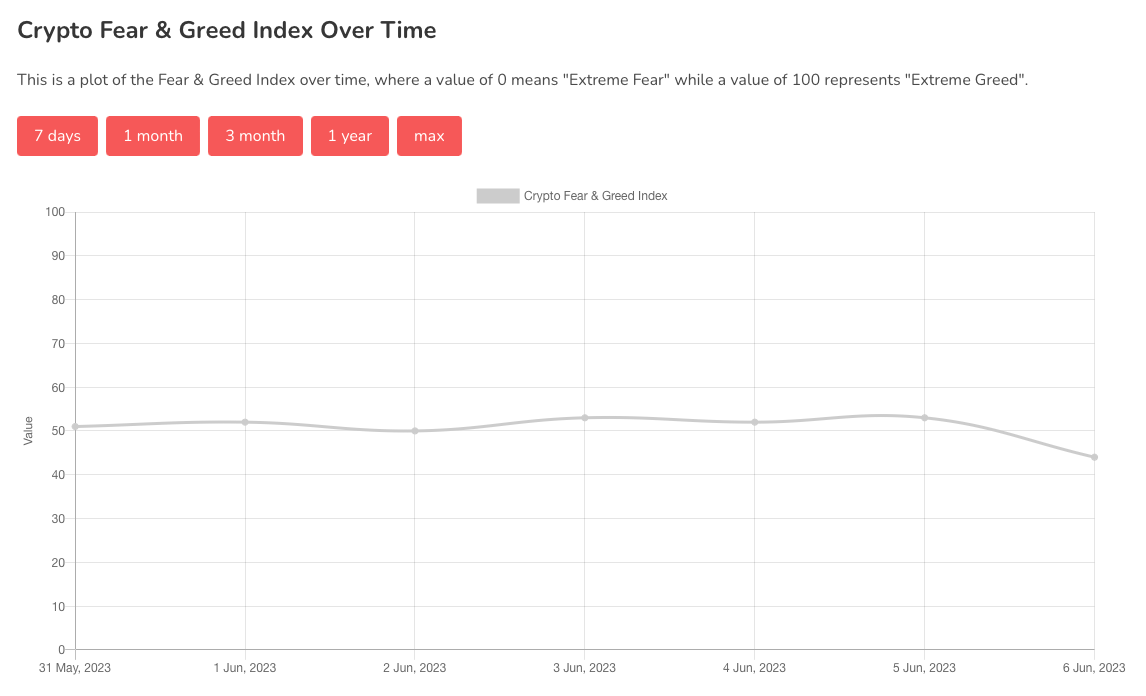
Chart #5 - Bitcoin Fear and Greed Index
The Bitcoin Fear and Greed Index is sitting at 44 today, indicating Fear.
The highest the index has been over the past seven days is 53, and the lowest is 44.
Banter’s Take
The market will easily digest the news relating to the SEC going after CZ and Binance U.S. The way this plays out on a chart is usually the establishment of a new trading range. Once the new range forms, we will have new and improved data to work with and hence better set-up trades.
Stay safe my friends!
Go to our Crypto Banter Discord here where Sheldon and Kyle give updates on the charts and trades from The Daily Candle newsletter!