

📈📉 We Are Going Long On SOL When It Reaches…
📈📉 We Are Going Long On SOL When It Reaches…

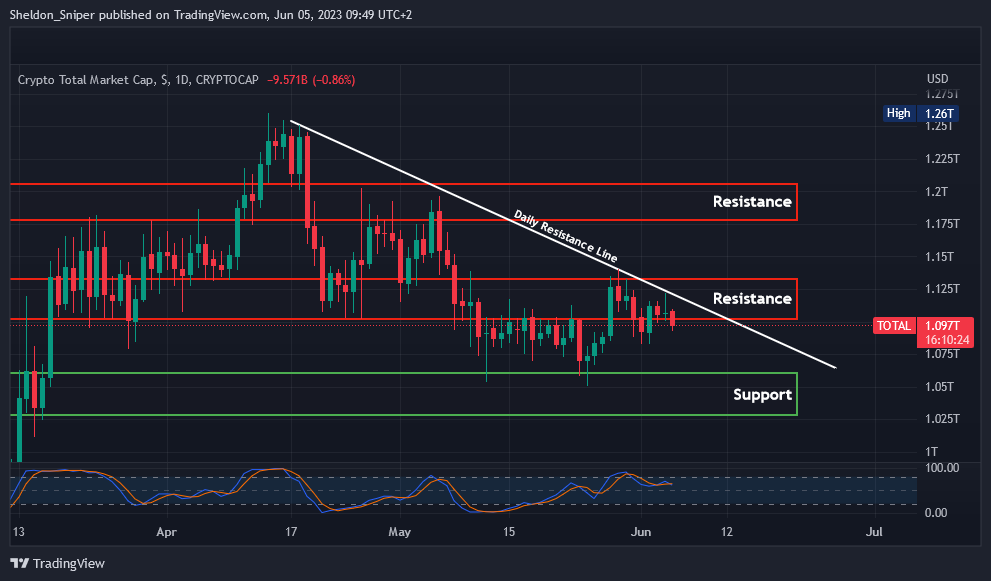
Chart #1 - TOTAL 1-Day Chart
Chartist: Sheldon
(For the chart screenshot, click here.)
Yesterday, the Total Market Cap (TOTAL) was rejected at the daily descending resistance line, around $1.125T. Overnight, it dropped to $1.097T.
The daily Stochastic RSI continues to trend downward, indicating that the TOTAL might still decline further, potentially testing the next major support area at $1.025T - $1.06T.
Should the market rally once again and break the daily descending resistance line, the next resistance stands at $1.13T, followed by a major resistance line ranging between $1.175T and $1.2T.
𝗣𝗿𝗶𝗺𝗲 𝗫𝗕𝗧
Sign up for a new Trading Account on Prime XBT!
Receive a deposit bonus of up to $7,000 with promo code: SheldonSniper
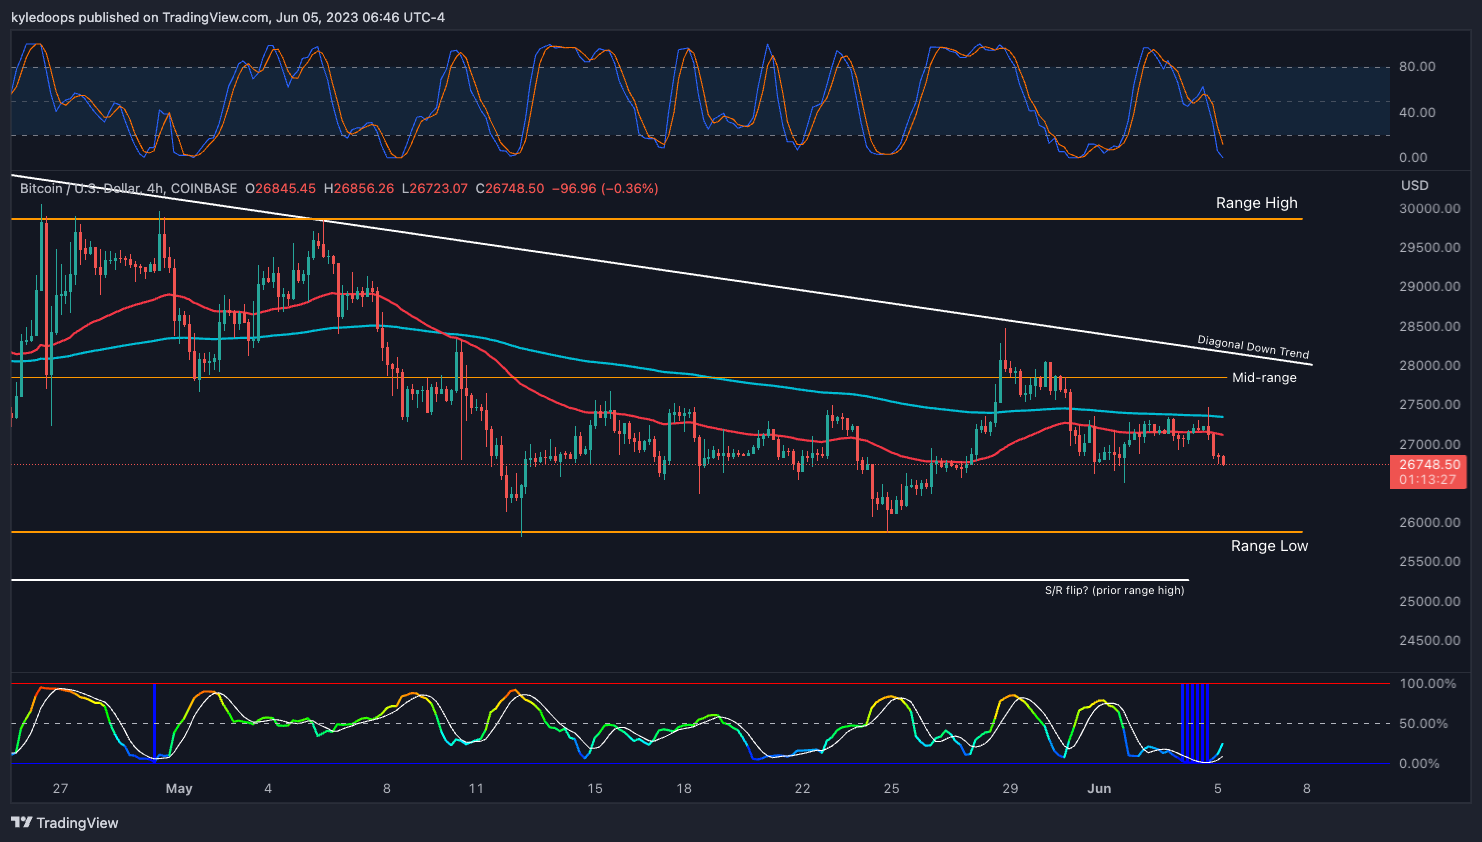
Chart #2 - Bitcoin (BTCUSD) 4-Hour Chart
Chartist: Kyle
(For the chart screenshot, click here.)
Bitcoin has once again been cleanly rejected at the resistance of the 50 and 200 EMA. The failure to break back above that level means that the risk remains to the downside.
The next level of support is between $25,200 - $25,800. This zone lines up with the low timeframe range's low and the prior high timeframe range's high. The latter hasn't been retested since the price broke out. Therefore, this might be the moment when a retest of the previous resistance occurs.
If it flips into support and the price bounces, it could line up nicely with bitcoin's next higher low on the daily timeframe.
𝗣𝗿𝗶𝗺𝗲 𝗫𝗕𝗧
Sign up for a new Trading Account on Prime XBT!
Receive a deposit bonus of up to $7,000 with promo code: KyleDoops
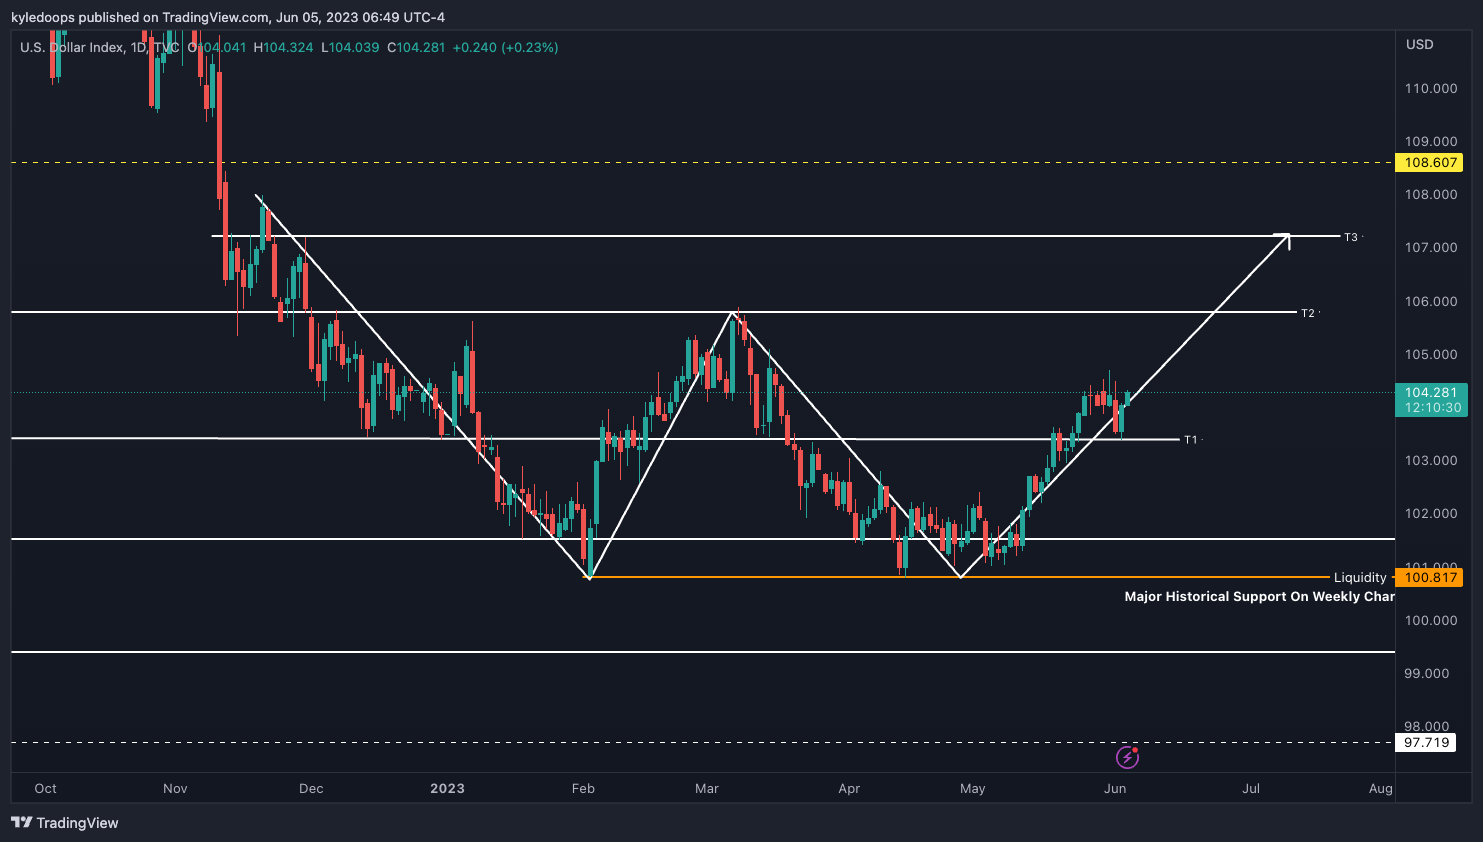
Chart #3 - U.S. Dollar (DXY) 1-Day Chart
Chartist: Kyle
(For the chart screenshot, click here.)
The DXY was showing signs of breaking down on the daily timeframe last week. However, that breakdown failed to occur as it could only be validated or confirmed with closes below the T1 target at 103.4.
Instead, the DXY retested that area perfectly, and subsequently bounced from there. The same principle remains true: the breakdown cannot be confirmed until candles close below the T1 zone.
It's likely to continue its upward trend towards the T2 target. A break above the T2 target would confirm the W pattern as seen in the chart.
Claim your Bitget sign-up bonuses here (details below).
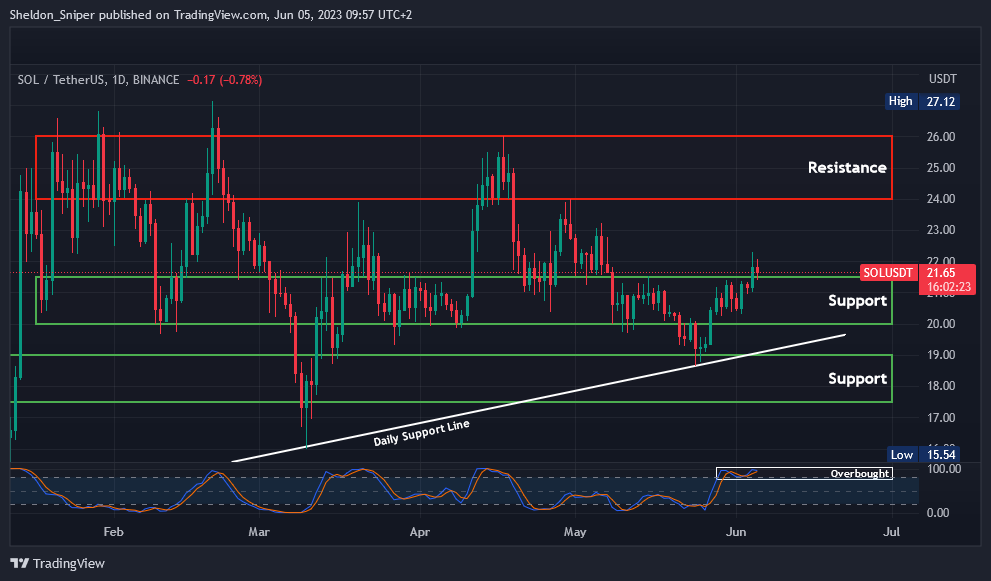
Chart #4 - Solana (SOLUSDT) 1-Day Chart
Chartist: Sheldon
(For the chart screenshot, click here.)
Over the last two weeks, the price of SOL has rallied by over 18%, surging from below $19 two weeks ago to yesterday's high of $22.30.
The price is currently overbought on higher time frames, suggesting there might be a pullback to retest lower areas of support. The first support lies at $21.00, followed by the second support around $20.00. That could provide an area for a long entry into SOL.
As cash seems to be leaving BTC and flowing into certain altcoins, the possibility of a further rally over the next couple of weeks is highly likely. If SOL continues its rally from here, the next significant area of resistance is between $24 - $26.
Claim your Bitget sign-up bonuses here (details below).
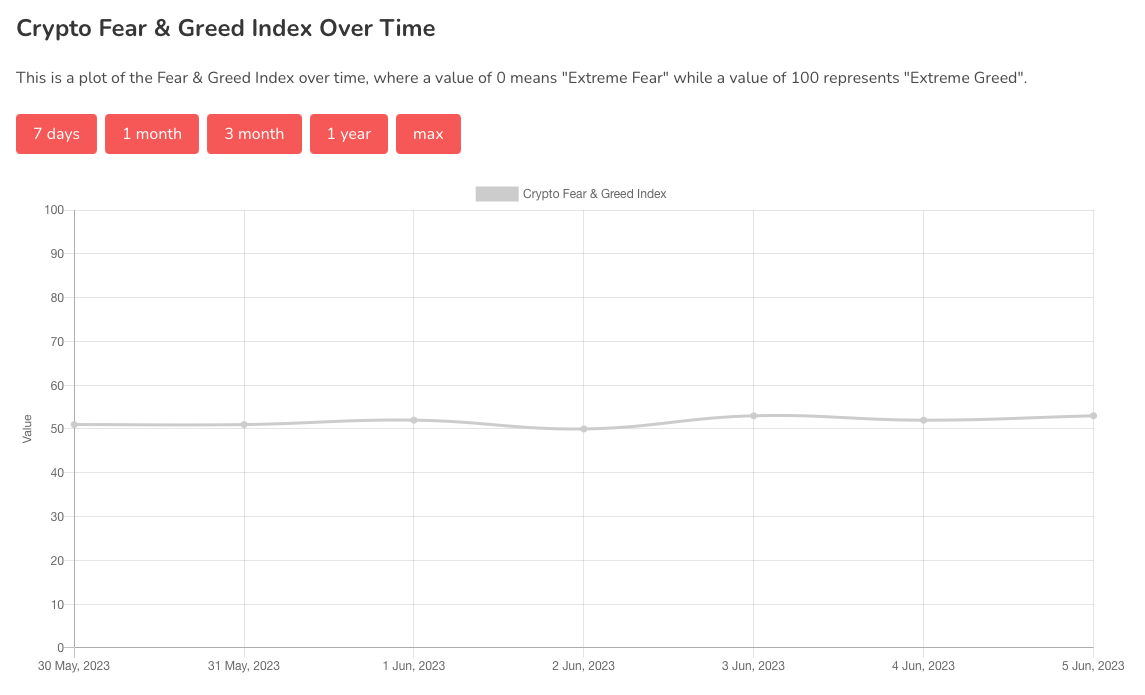
Chart #5 - Bitcoin Fear and Greed Index
The Bitcoin Fear and Greed Index is sitting at 53 today, Neutral.
The highest the index has been over the past seven days is 53, and the lowest is 50.
Banter’s Take
Bulls may have counted their chickens before they hatched and prices have not turned fully bullish yet. Bitcoin is bearish across all timeframes except the daily timeframe. Now, a daily higher low looks like Bitcoin bulls' final line of defense.
Stay safe my friends!
Go to our Crypto Banter Discord here where Sheldon and Kyle give updates on the charts and trades from The Daily Candle newsletter!