

📈📉 We Are Trading Filecoin (FIL) Up To This Level!
📈📉 We Are Trading Filecoin (FIL) Up To This Level!

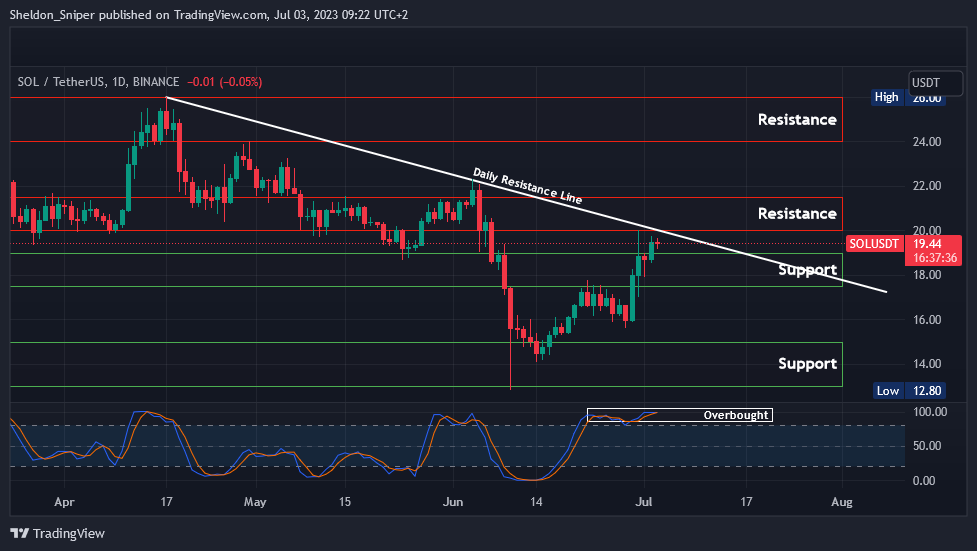
Chart #1 - Solana (SOLUSDT) 1-Day Chart
Chartist: Sheldon
(For the chart screenshot, click here.)
The last two weeks of June have been exceptionally good for SOL, as it has rallied from around $13 up to $20. But the price is now facing resistance.
The price is also overbought on higher time frames, so SOL could either consolidate in this area between $19 and $20 or experience a deeper retrace to around the $18 level. If $18 does not hold, it will drop to around $16.
To the upside, if both the daily descending resistance line, originating from mid-April, and the $20 - $21.50 area of resistance are broken, I believe SOL will head to $24 - $26.
I still think SOL has further upside in July, and a short-term retracement in the price could provide a good opportunity for a long entry - once the trend reverses to the upside again.
Sign-up and trade on Bybit today.
Exclusive $30,000 deposit rewards and bonuses up for grabs!
Chart #2 - Bitcoin (BTCUSD) 1-Hour Chart
Chartist: Kyle

(For the chart screenshot, click here.)
Bitcoin has been respecting the range with extreme precision.
Currently, the price is situated at the mid-range, which has confluence with the bottom side of the parallel channel.
If we see another sweep into this mid-range level, it could open up the possibility of a bounce. This could potentially lead back to $31,500, which is the range high and the top of the parallel channel.
𝗣𝗿𝗶𝗺𝗲 𝗫𝗕𝗧
Sign up for a new Trading Account on Prime XBT!
Receive a deposit bonus of up to $7,000 with promo code: KyleDoops

Sign up for a new Trading Account on Prime XBT!
Receive a deposit bonus of up to $7,000 with promo code: SheldonSniper
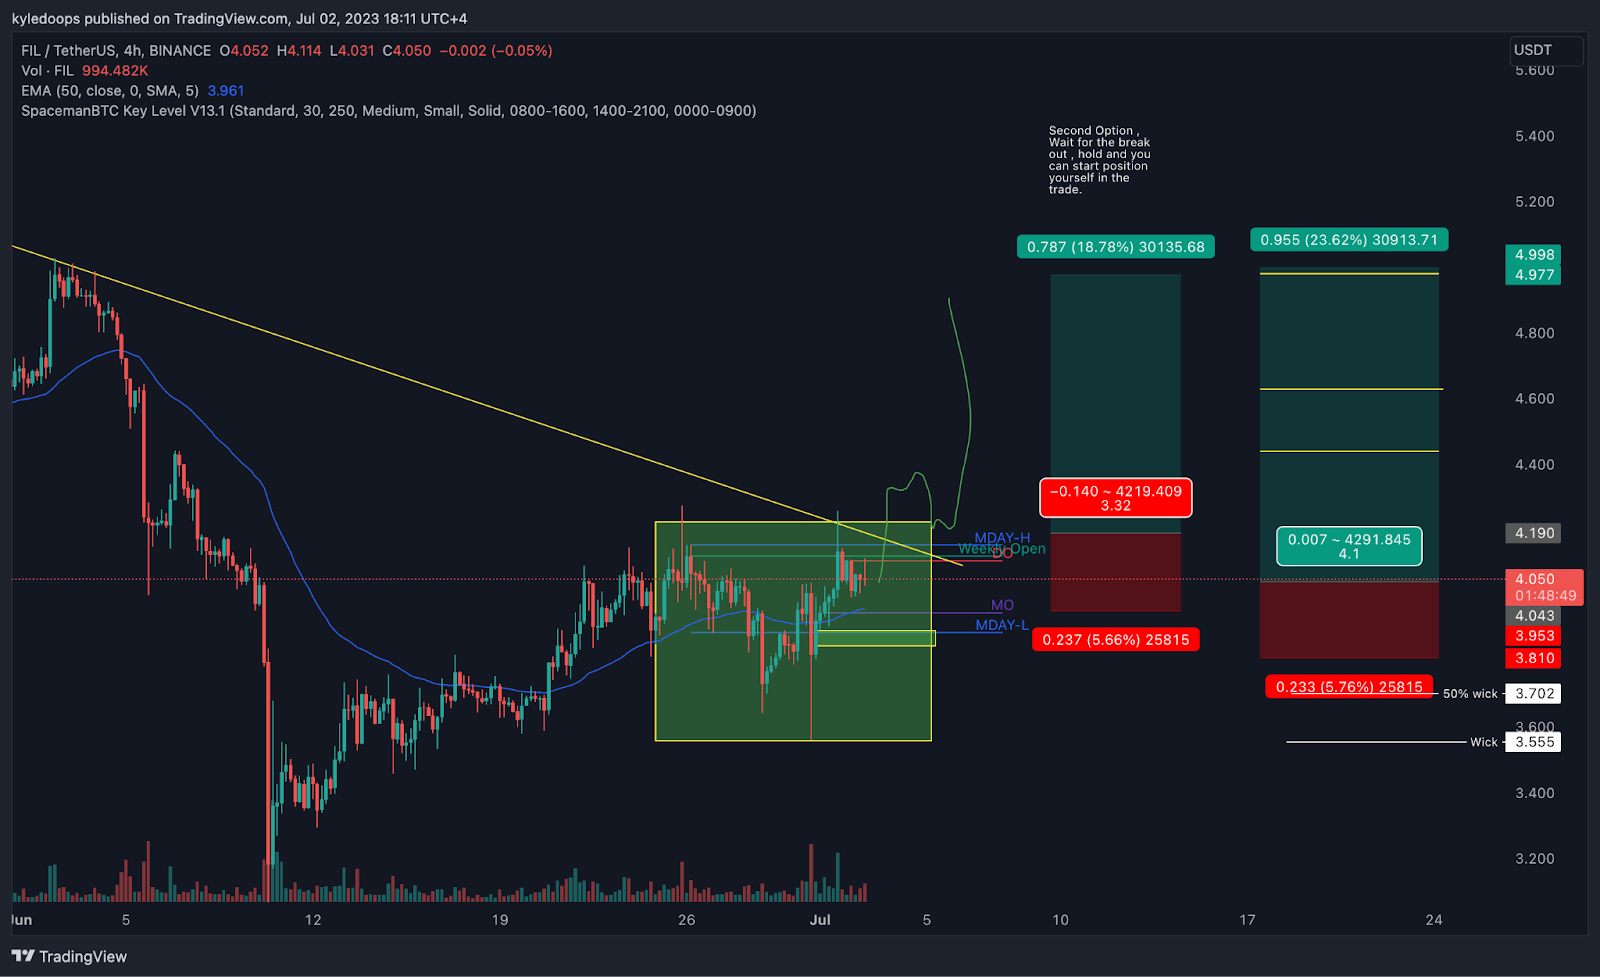
Chart #3 - Filecoin (FILUSDT) 4-Hour Chart
Chartist: Kyle
(For the chart screenshot, click here.)
A break of this trend line, with a move back into the Monday high, would create a trigger to open a long position.
The target for the long position would be $4.99.
My stop loss would be set at $3.81.
Claim your Bitget sign-up bonuses here (details below).
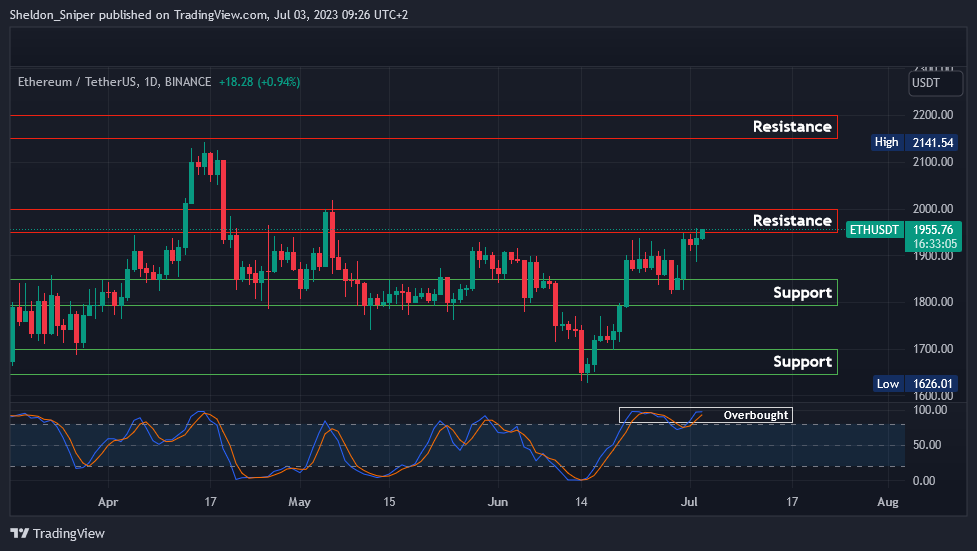
Chart #4 - Ethereum (ETHUSDT) 1-Day Chart
Chartist: Sheldon
(For the chart screenshot, click here.)
ETH is overbought on higher time frames and is currently trading in the $1,950 - $2,000 resistance area.
If it retraces from here, it will head to $1,800 - $1,850, and a failure to hold that level will send it to $1,650 - $1,700.
But, if ETH continues to rally from here and manages to break through $2,000, it could visit $2,150 - $2,200 soon.
Claim your Bitget sign-up bonuses here (details below).
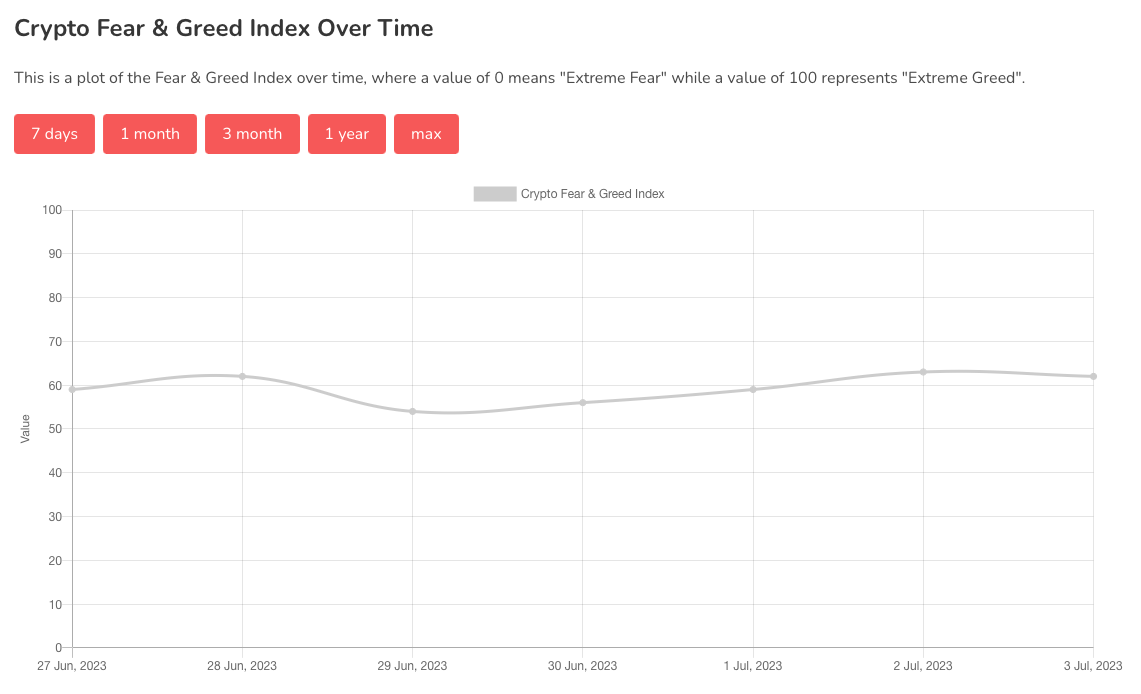
Chart #5 - Bitcoin Fear and Greed Index
The Bitcoin Fear and Greed Index is sitting at 62 today, indicating Greed.
The highest the index has been over the past seven days is 63, and the lowest is 54.
Banter’s Take
The market had a strong monthly close, which has led to an uptick in the MACD that has now crossed the zero line. This suggests that there is more than likely going to be continued upward momentum in the weeks to come.
To read more macro analysis on Bitcoin, check out today’s Good Morning Crypto - and don’t forget to share it with your friends and subscribe to both newsletters for daily alpha!
Stay safe my friends!
Go to our Crypto Banter Discord here where Sheldon and Kyle give updates on the charts and trades from The Daily Candle newsletter!