

📈📉 We Are Trading Kaspa! This is Our Next Move!
📈📉 We Are Trading Kaspa! This is Our Next Move!

Chart #1 - Bitcoin Dominance (BTC.D) 1-Week Chart
Chartist: Sheldon

(For the chart screenshot, click here.)
After breaking out of the major two-year resistance level at 49%, Bitcoin Dominance has continued to rise over the past few weeks.
It currently stands at 51.8%, having importantly reached the next major resistance area of 52% - 53%. This area is also where the 200 Moving Average (200MA) on the weekly chart can be found. The 200MA and the current resistance will be very tough to break through, so I anticipate a rejection in this area, leading to a reversal in the BTC.D trend and a downward move to the previous range high of 48% - 49%.
Sign-up and trade on Bybit today.
Exclusive $30,000 deposit rewards and bonuses up for grabs!
Chart #2 - Ethereum (ETHUSD) 1-Hour Chart
Chartist: Kyle
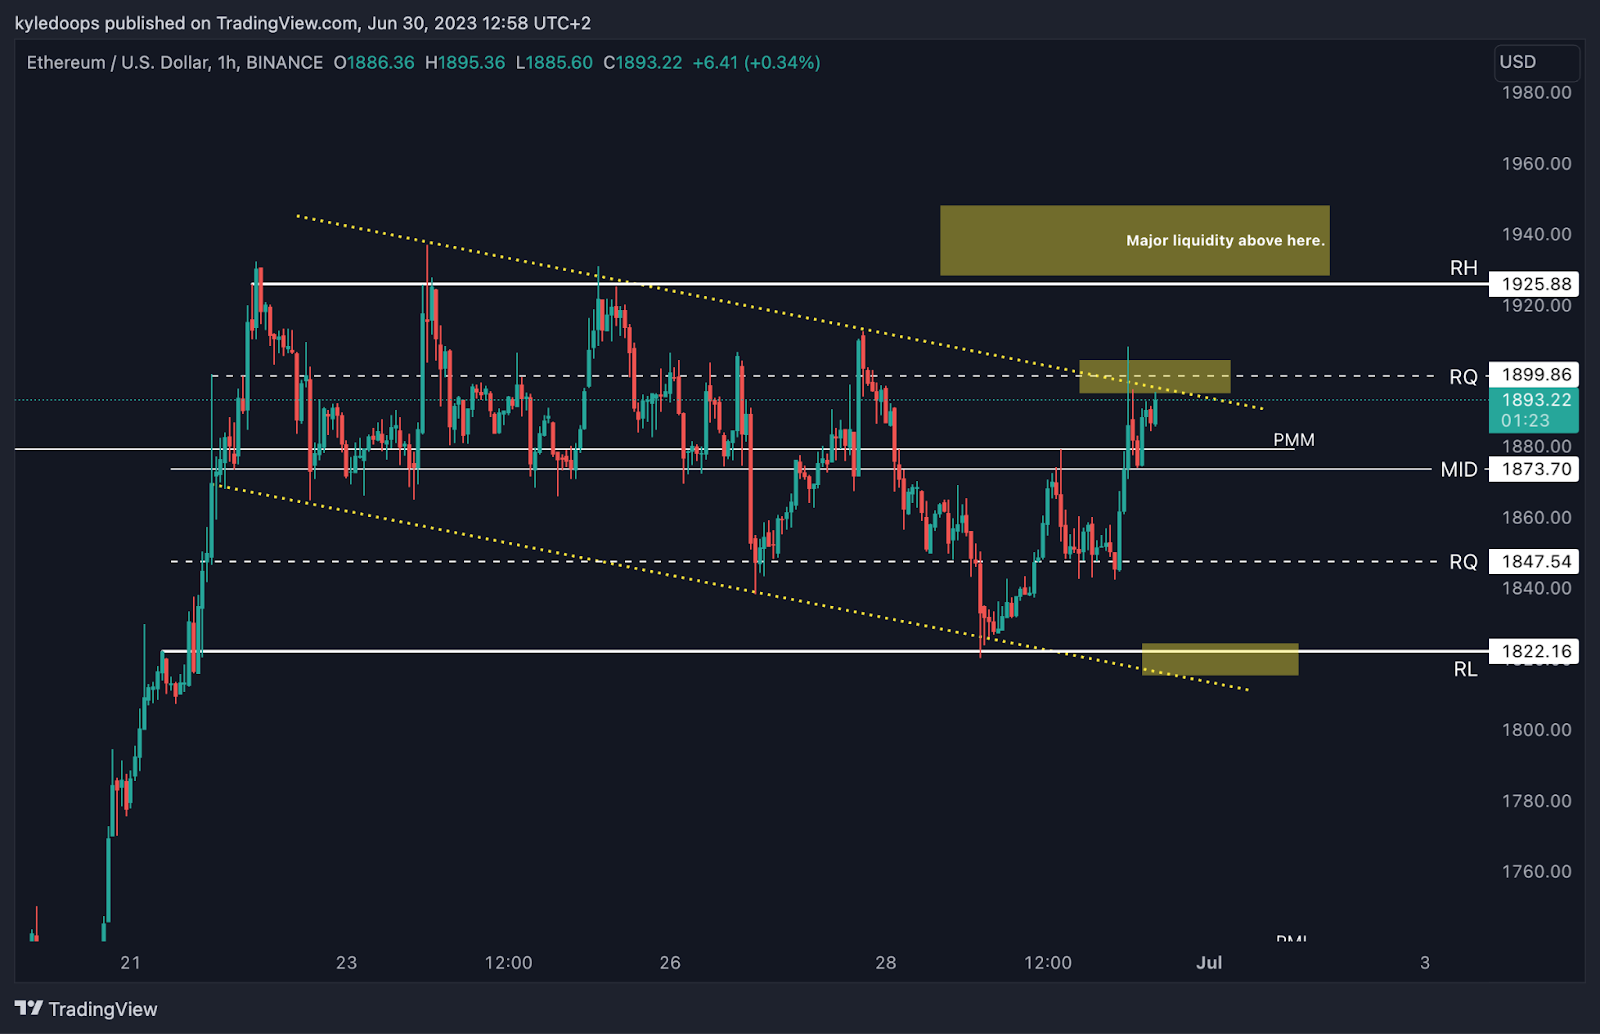
(For the chart screenshot, click here.)
ETH is currently consolidating within the flag portion of the bull flag.
Short-term traders might consider playing this range before it breaks out. The area currently holding the price, highlighted in yellow, could potentially prompt another sell-off to the downside. If this happens, watch for support at $1,822.
This could be the final bounce before moving up to take the upside liquidity.
𝗣𝗿𝗶𝗺𝗲 𝗫𝗕𝗧
Sign up for a new Trading Account on Prime XBT!
Receive a deposit bonus of up to $7,000 with promo code: KyleDoops

Sign up for a new Trading Account on Prime XBT!
Receive a deposit bonus of up to $7,000 with promo code: SheldonSniper
Chart #3 - Kaspa (KASUSDT) 4-Hour Chart
Chartist: Kyle
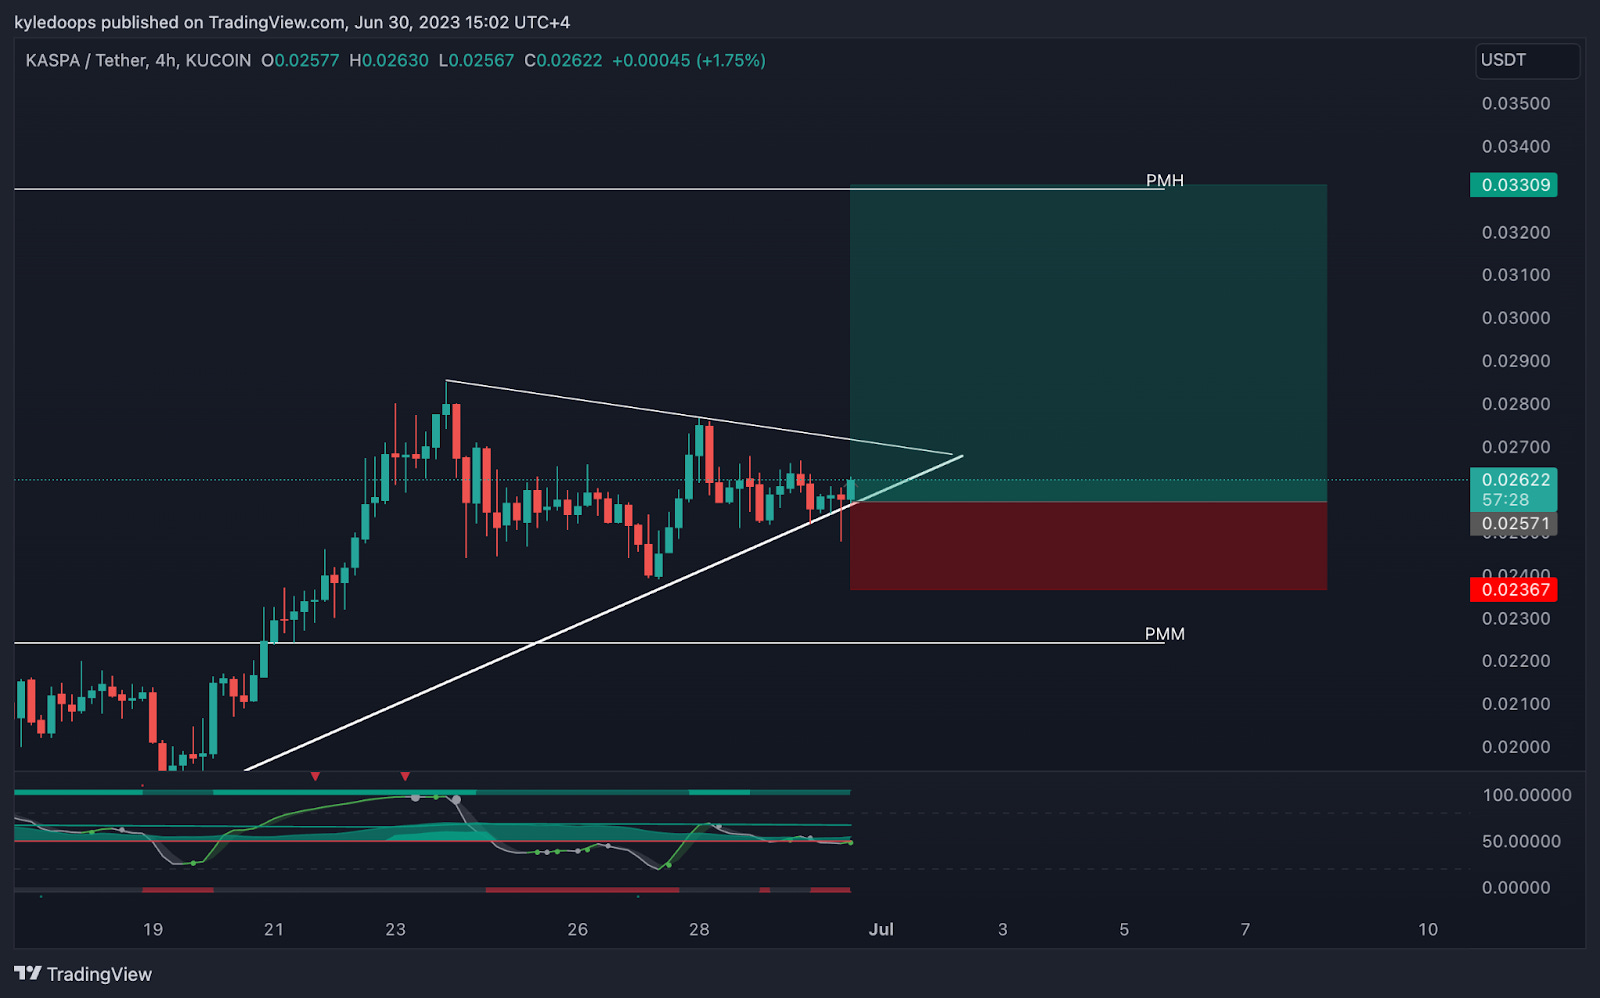
(For the chart screenshot, click here.)
KAS is currently in an uptrend against Bitcoin.
I mentioned this trade on the show. My stop loss is set at $0.02367, with a take-profit target at $0.03309.
Once we are sufficiently in profit, we’ll de-risk by raising the stop to the break-even point or slightly above the entry level.
Claim your Bitget sign-up bonuses here (details below).
Chart #4 - Bitcoin (BTCUSDT) 1-Day Chart
Chartist: Sheldon

(For the chart screenshot, click here.)
Over the past week, Bitcoin has been ranging between $30,400 and $31,400, with the crucial $30,500 level consistently holding as support.
The price is currently trading at $30,800, and the daily Stoch RSI remains high, but it might continue to range for some time.
For a bullish market outlook, BTC needs to break the $31,000 - $31,800 range and then test $32,000 - $34,000. A drop below the $30,500 support level could potentially drive the price down to test the lower range support at $29,800 once again.
Claim your Bitget sign-up bonuses here (details below).
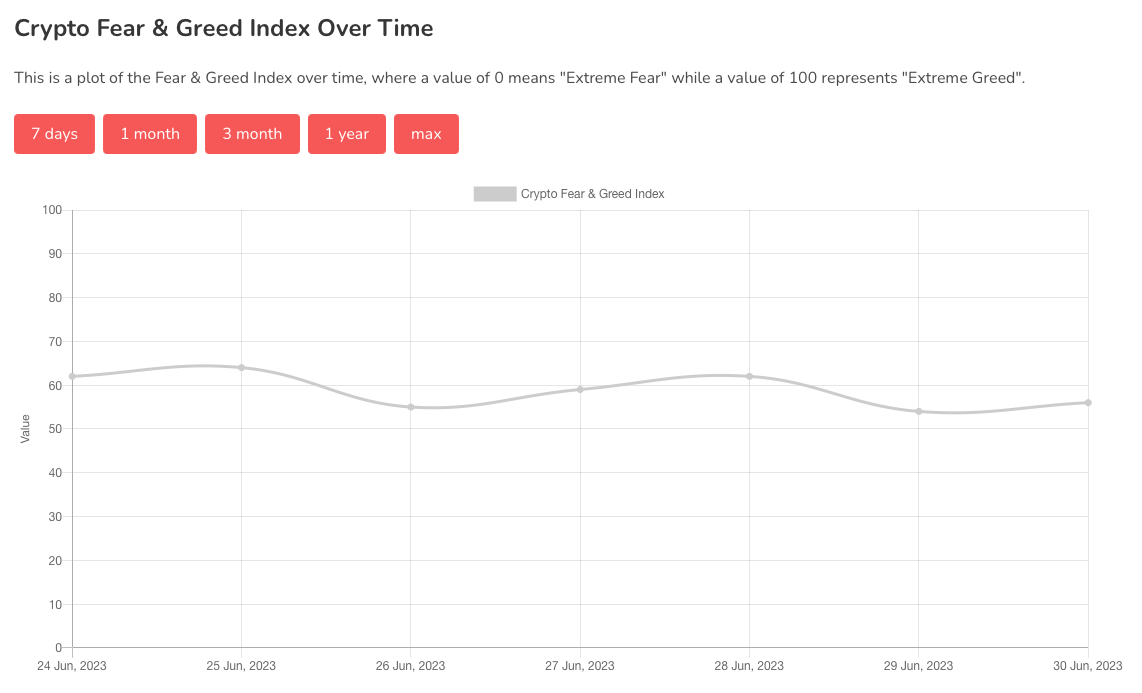
Chart #5 - Bitcoin Fear and Greed Index
The Bitcoin Fear and Greed Index is sitting at 56 today, indicating Greed.
The highest the index has been over the past seven days is 64, and the lowest is 54.
Banter’s Take
The market appears ripe for continuation. If the monthly close is at this level or higher, we should expect a continuation on the high timeframe.
Stay safe my friends!
Go to our Crypto Banter Discord here where Sheldon and Kyle give updates on the charts and trades from The Daily Candle newsletter!