

📈📉 We Go Long on Bitcoin After This Happens!
📈📉 We Go Long on Bitcoin After This Happens!

Chart #1 - Solana (SOLUSDT) 1-Day Chart
Chartist: Sheldon

(For the chart screenshot, click here.)
SOL is currently attempting to break out of its daily descending resistance line that dates back to the middle of April, while simultaneously trading in the major resistance area of $20 - $21.50.
At the moment, the price is extremely bullish compared to the rest of the crypto market, but it is also very overbought on higher time frames.
If SOL can break through both the daily resistance line and the current area of resistance, it should head to $24 - $26. That area was last tested in mid-April. If it can’t though, it will probably head to $17.50 - $18.30. If the price finds support there, it could be a nice area for a long trade.
Sign-up and trade on Bybit today.
Exclusive $30,000 deposit rewards and bonuses up for grabs!
Chart #2 - Bitcoin (BTCUSD) 1-Hour Chart
Chartist: Kyle
(For the chart screenshot, click here.)
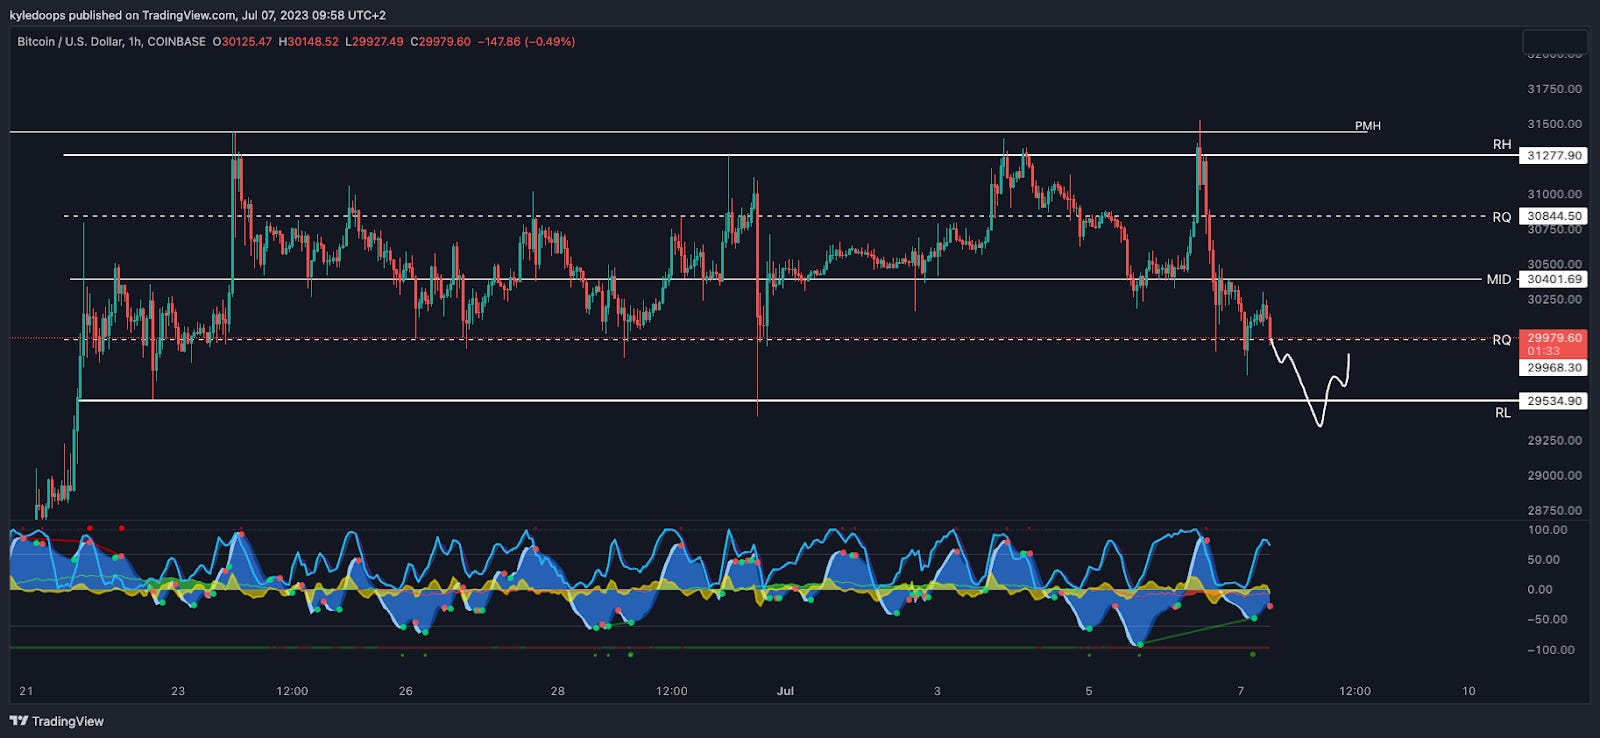
Bitcoin, on the hourly chart, remains range-bound with its price currently trending back down towards the range lows at $29,534.
We anticipate a sweep of these range lows and so we’ll watch for a deviation back into the range. Such a deviation would be our opportunity to go long.
Also, there is a bullish divergence forming, which becomes apparent when looking at the indicator below.
𝗣𝗿𝗶𝗺𝗲 𝗫𝗕𝗧
Sign up for a new Trading Account on Prime XBT!
Receive a deposit bonus of up to $7,000 with promo code: KyleDoops

Sign up for a new Trading Account on Prime XBT!
Receive a deposit bonus of up to $7,000 with promo code: SheldonSniper
Chart #3 - S&P 500 (ES1!) 1-Day Chart
Chartist: Kyle
(For the chart screenshot, click here.)
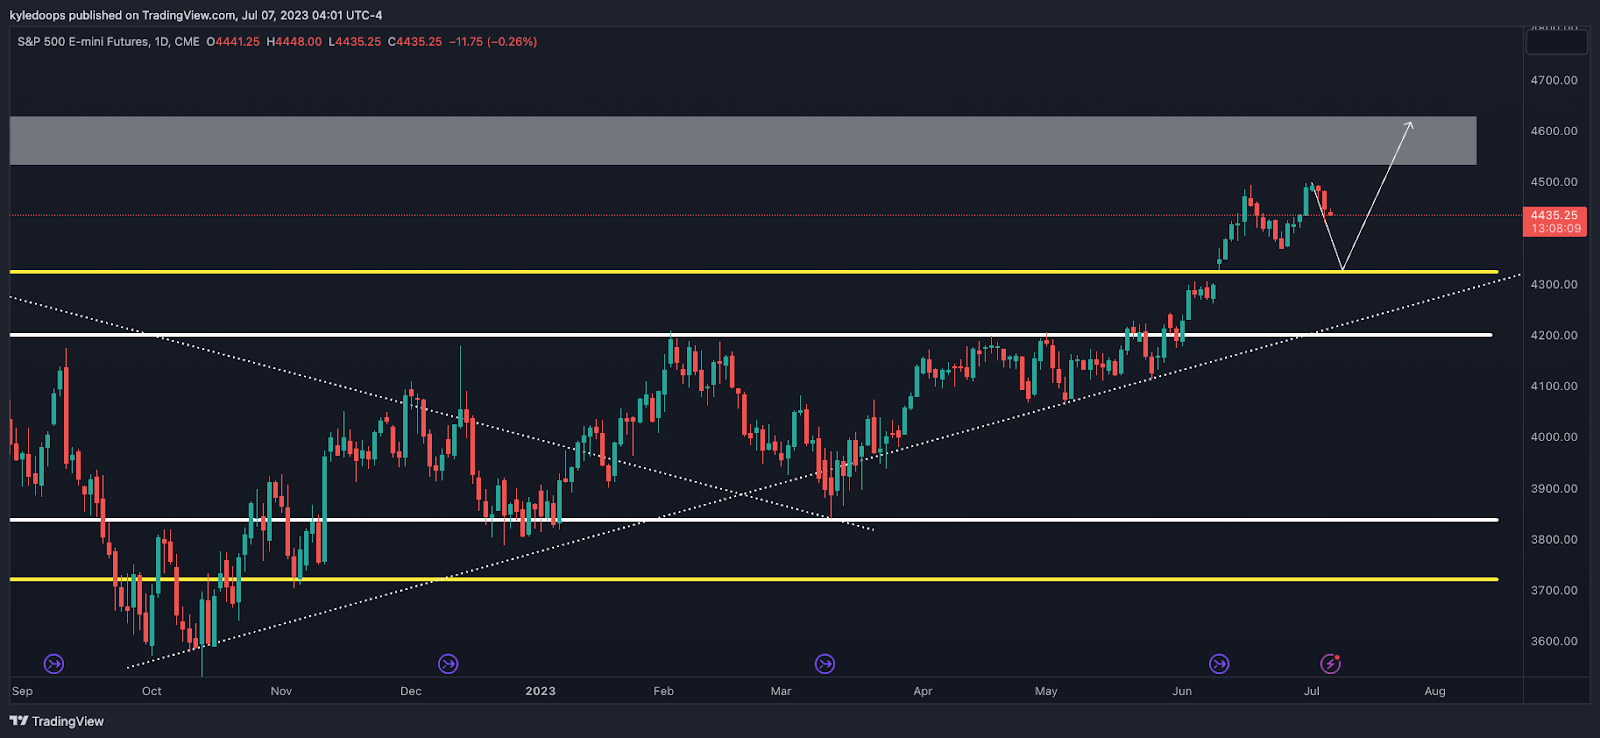
The ES1! (which is the S&P 500 futures chart) is currently pulling back.
This could provide a test into the 4,325 level, which happens to be the range high of the broader range from which the S&P 500 broke out of.
Expect a probable bounce off of that range high level, after which the next major resistance is at 4,600.
Claim your Bitget sign-up bonuses here (details below).
Chart #4 - U.S. Government Bonds 10-Year Yield 1-Week Chart
Chartist: Sheldon
(For the chart screenshot, click here.)
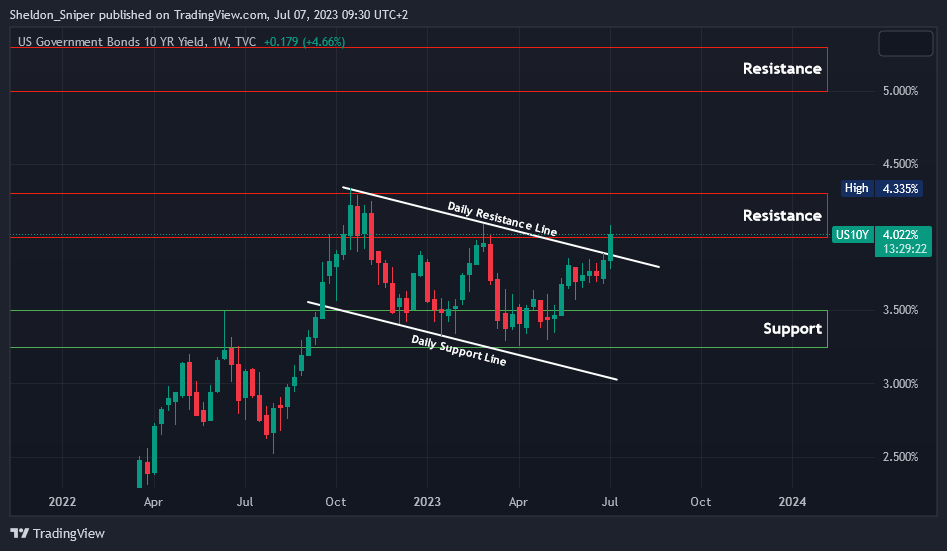
Since October last year, the 10 Year Yield has been in a downtrend while forming a bull flag structure.
The stock and crypto markets have been very bullish over the past nine months. Yet, this week, the 10 Year Yield broke out of the bull flag, signaling both an increase in demand and concerns about uncontrolled inflation, which could hint at further rate hikes.
Currently, the 10 Year Yield is within the 4% - 4.3% resistance area. If it manages to break through it in the upcoming weeks, it will be bad for the markets. The next major resistance beyond this is at 5% - 5.5%, an area last tested fifteen years ago.
On the other hand, if the 10 Year Yield faces rejection within this range, the next support level stands at 3.25% - 3.5%.
Claim your Bitget sign-up bonuses here (details below).
Chart #5 - Bitcoin Fear and Greed Index
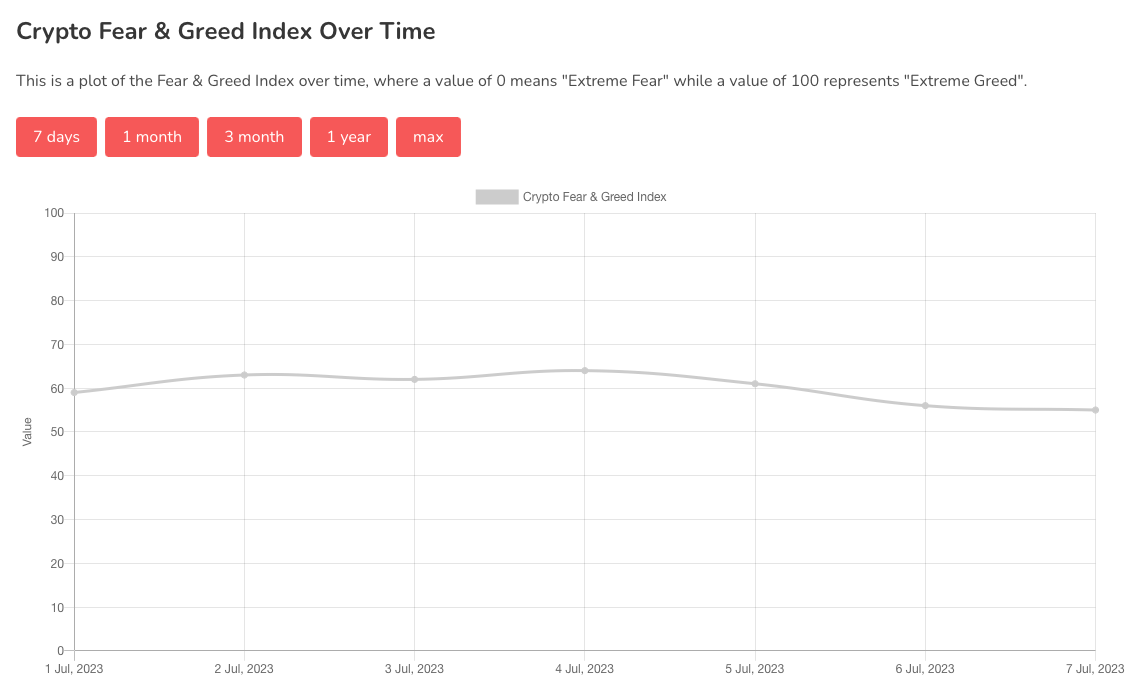
The Bitcoin Fear and Greed Index is sitting at 55 today, indicating Greed.
The highest the index has been over the past seven days is 64, and the lowest is 55.
Banter’s Take
Bitcoin continues to remain range-bound following a major upward move, so it is still consolidating in the flag portion of the bull flag. If Bitcoin manages to hold its range low, the bull flag remains intact.
Stay safe my friends!
Go to our Crypto Banter Discord here where Sheldon and Kyle give updates on the charts and trades from The Daily Candle newsletter!