

📉 Weekly Close in Red CONFIRMS Pullback!
📉 Weekly Close in Red CONFIRMS Pullback!
Is BTC Forming a NEW Trading Range?
Overview
Chart #1 - Polygon (MATICUSDT) Daily
Chart #2 - Bitcoin (BTCUSD) Hourly
Chart #3 - Invesco QQQ Trust (QQQ) Daily
Chart #4 - Chainlink (LINKUSDT) 8-Hour
Chart #5 - Fear and Greed Index

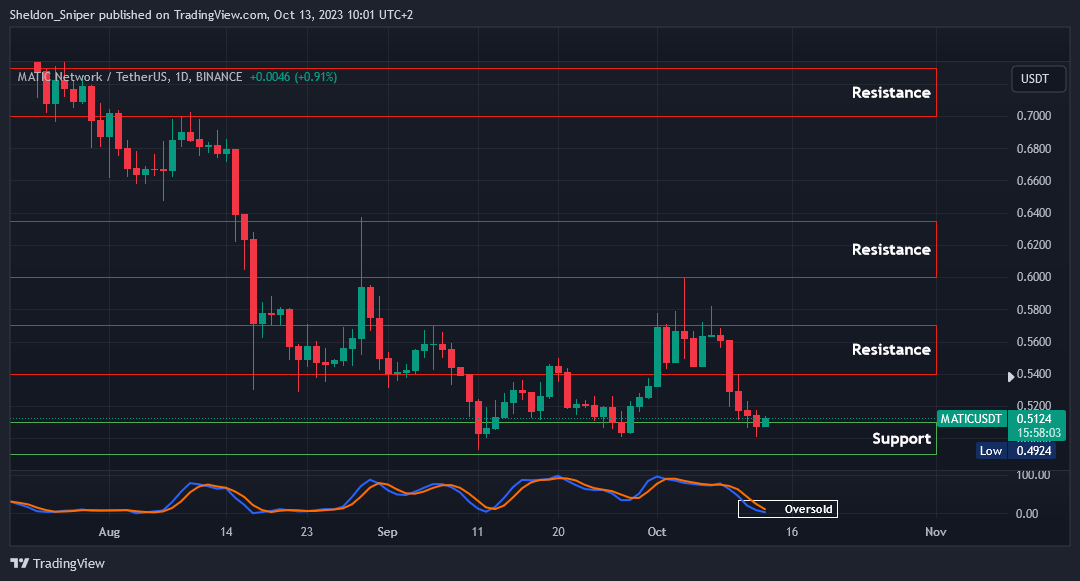
Chart #1 - Polygon (MATICUSDT) Daily
Chartist: Sheldon
(For the chart screenshot, click here.)
MATIC has retraced down to the $0.49 - $0.51 area of support, and with the price oversold on higher timeframes, I am now watching the higher time frame price action very closely for a possible bounce or trend reversal.
Yesterday, the price reversed off $0.50, and today it is trading a little higher at $0.5124. If the trend does reverse, there is a possibility of another test of the next area of resistance, which is between $0.54 - $0.57, or even possibly the $0.60 level that was last tested at the beginning of October.
Sign-up and trade on Bybit today.
Exclusive $30,000 deposit rewards and bonuses up for grabs!
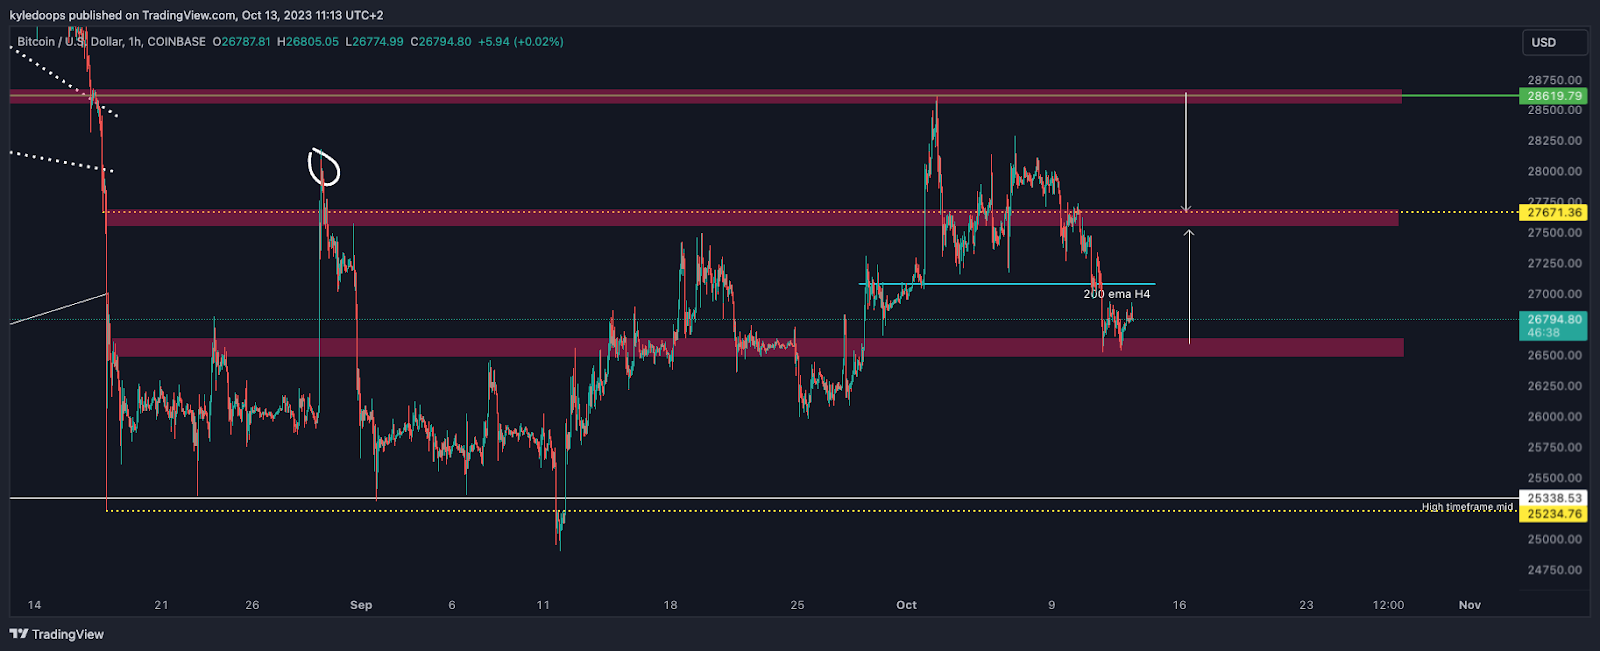
Chart #2 - Bitcoin (BTCUSD) Hourly
Chartist: Kyle
(For the chart screenshot, click here.)
Bitcoin is currently attempting to flip $26,500 into support. This was the prior mid-range, which, if flipped, will become the new range low.
Meaning, Bitcoin could be opening up a new trading range between $26,500 and $28,600.
This has been illustrated by the arrows.
Bulls will be looking to reclaim the 200 EMA, indicated by the blue line, for an attempt back to the top of the range.
Claim your Bitget sign-up bonuses here (details below).
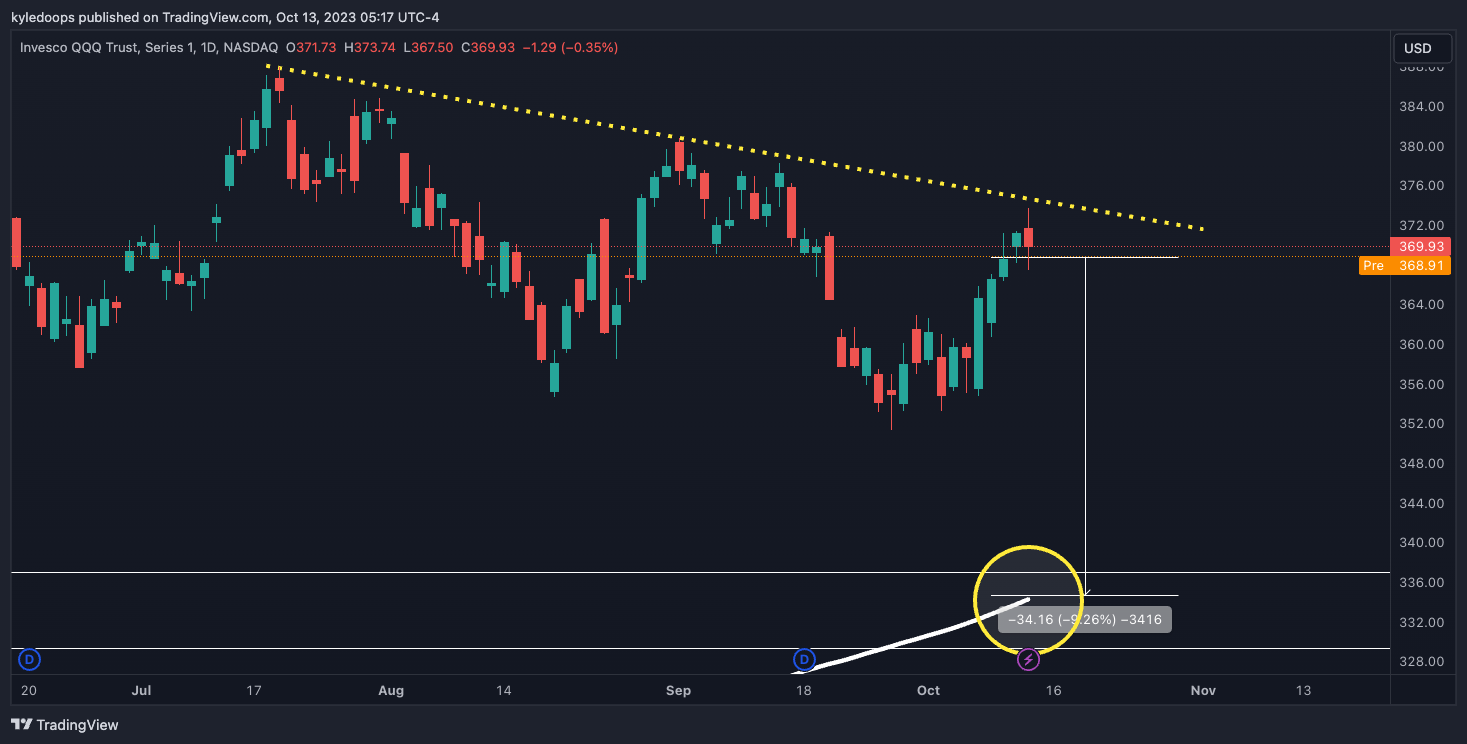
Chart #3 - Invesco QQQ Trust (QQQ) Daily
Chartist: Kyle
(For the chart screenshot, click here.)
The QQQ has tagged the diagonal down-sloping trend line and is currently rejecting.
Market participants should be aware that a full rejection off this zone could lead price all the way back down another 9.26% into the white 200 MA support, where you would then see the next major bounce.
Claim your Bitget sign-up bonuses here (details below).
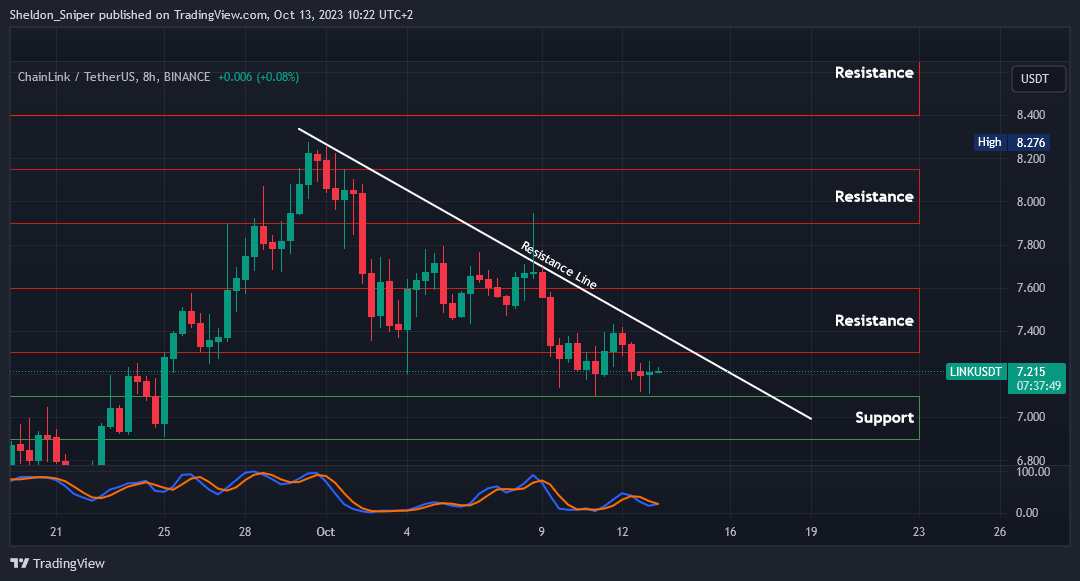
Chart #4 - Chainlink (LINKUSDT) 8-Hour
Chartist: Sheldon
(For the chart screenshot, click here.)
LINK has been consolidating in a tight range, between a support price of $7.10, and resistance of $7.40.
At this stage, I am waiting for the price to break out of this tight range. If it breaks through $7.40, and turns that level into support, I will then consider entering a long trade.
If the market does move up in the next couple of days, and LINK recovers the $7.40 level as support, then I could expect the price to go and test higher resistance levels, possibly even testing the end of September highs again at around $8.20.
Claim your Bitget sign-up bonuses here (details below).
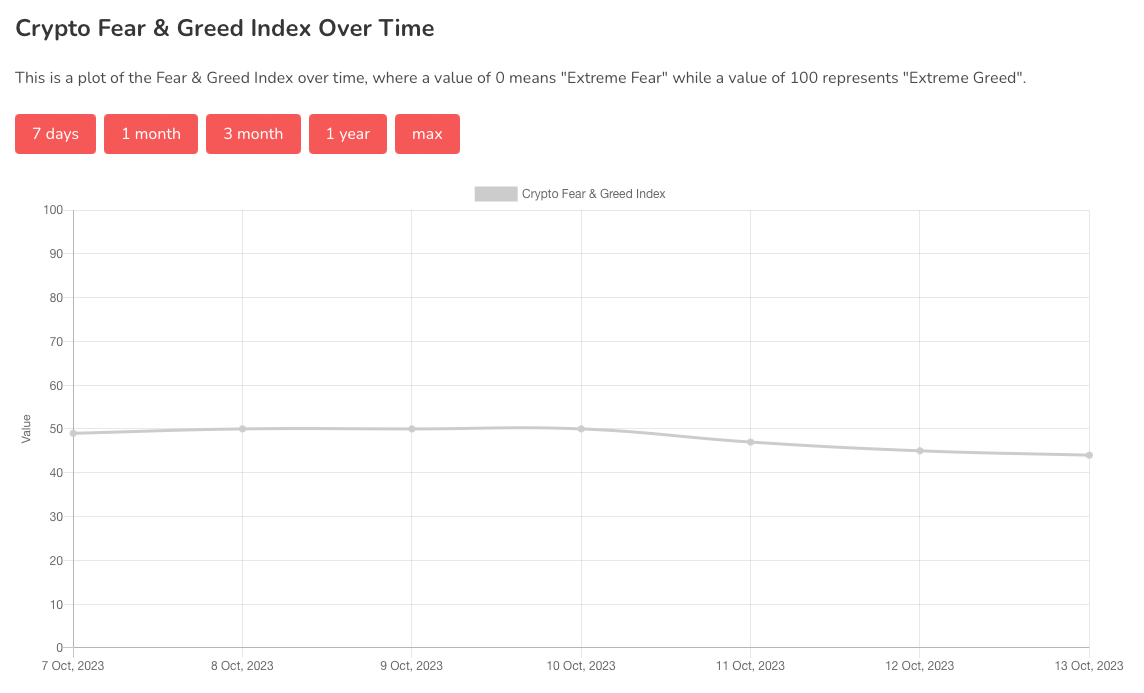
Chart #5 - Fear and Greed Index
The Fear and Greed Index is sitting at 44 today, indicating Fear.
The highest the index has been over the past seven days is 50, and the lowest is 44.
Banter’s Take
The market is digesting the slightly higher than expected CPI and PPI results from this week. A big one to watch is the DXY; a weekly close in red will confirm that the pullback is in full swing. Right now, the DXY weekly candle is green. Bearish invalidation for the DXY is a close above the wick high of last week.
Stay safe my friends!
Go to our Crypto Banter Discord here where Sheldon and Kyle give updates on the charts and trades from The Daily Candle newsletter!