

📈📉 Whale Dumps ARB: 23% Trade Opportunity!
📈📉 Whale Dumps ARB: 23% Trade Opportunity!

Overview
Chart #1 - Solana (SOLUSDT) 8-Hour Chart
Chart #2 - Arbitrum (ARBUSDT) Daily Chart
Chart #3 - Bitcoin (BTCUSD) Hourly Chart
Chart #4 - Crypto Total Market Cap (TOTAL) Daily Chart
Chart #5 - Fear and Greed Index

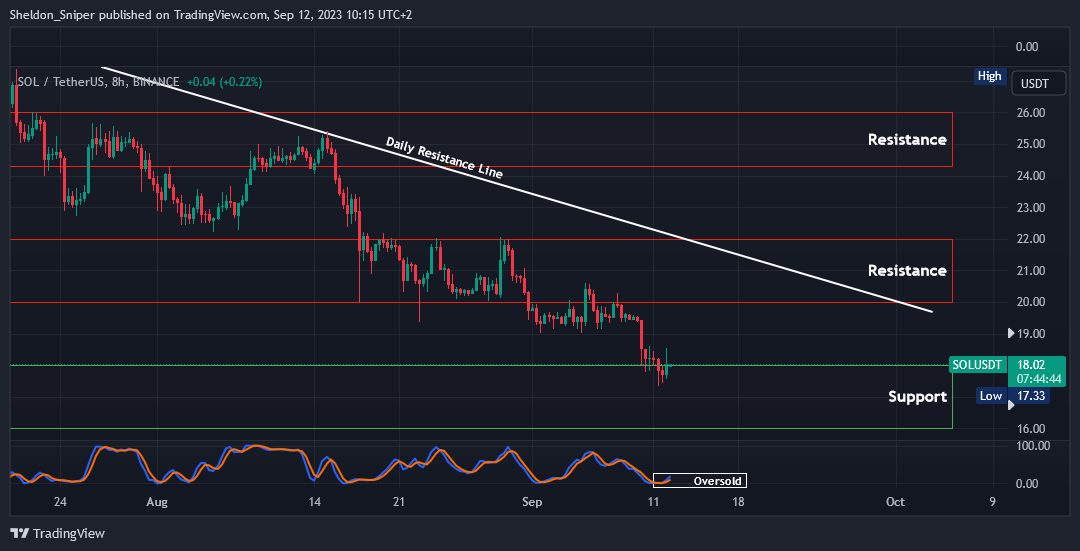
Chart #1 - Solana (SOLUSDT) 8-Hour Chart
Chartist: Sheldon
(For the chart screenshot, click here.)
SOL has stabilized around the $18.00 mark and is now oversold on higher time frames.
Although prices can stay oversold for an extended period, it might be gearing up to test as high as $20.00 - $22.00.
Should the crypto market continue its retracement though, SOL may visit $16.00.
𝗣𝗿𝗶𝗺𝗲 𝗫𝗕𝗧
Sign up for a new Trading Account on Prime XBT!
Receive a deposit bonus of up to $7,000 with promo code: SheldonSniper
Sign-up and trade on Bybit today.
Exclusive $30,000 deposit rewards and bonuses up for grabs!
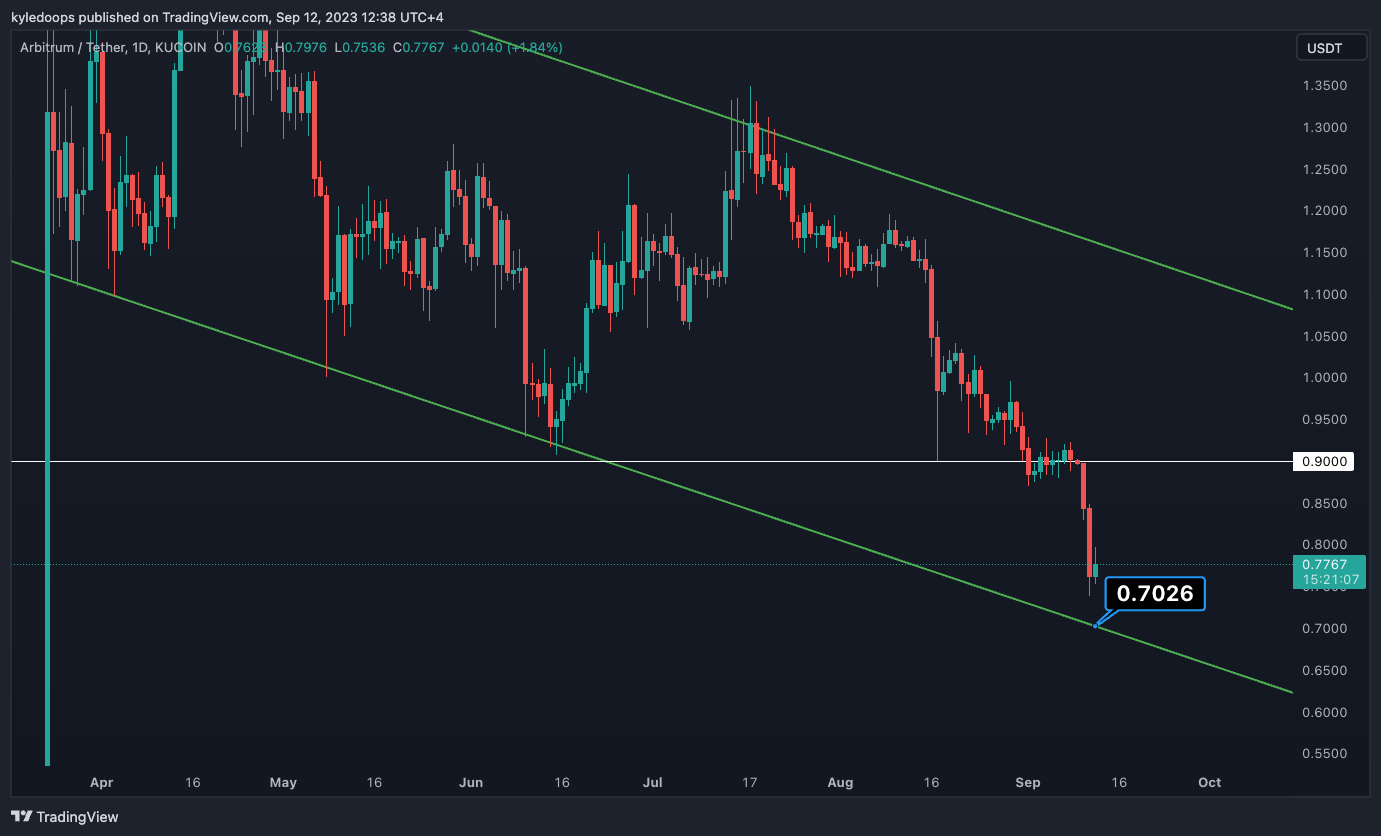
Chart #2 - Arbitrum (ARBUSDT) Daily Chart
Chartist: Kyle
(For the chart screenshot, click here.)
ARB has been sold off aggressively by a whale who required the capital to defend his AAVE loan. As a result, the price has plummeted significantly.
The next major support is at $0.7026, a pivot level derived from previous lower highs. Do not mistake this pivot level for a reversal or the ultimate low, as the trend continues downward. It's likely just the level that offers the first bounce opportunity since the sell-off began.
After that, keep an eye on the $0.90 level, which could serve as underside resistance.
𝗣𝗿𝗶𝗺𝗲 𝗫𝗕𝗧
Sign up for a new Trading Account on Prime XBT!
Receive a deposit bonus of up to $7,000 with promo code: KyleDoops
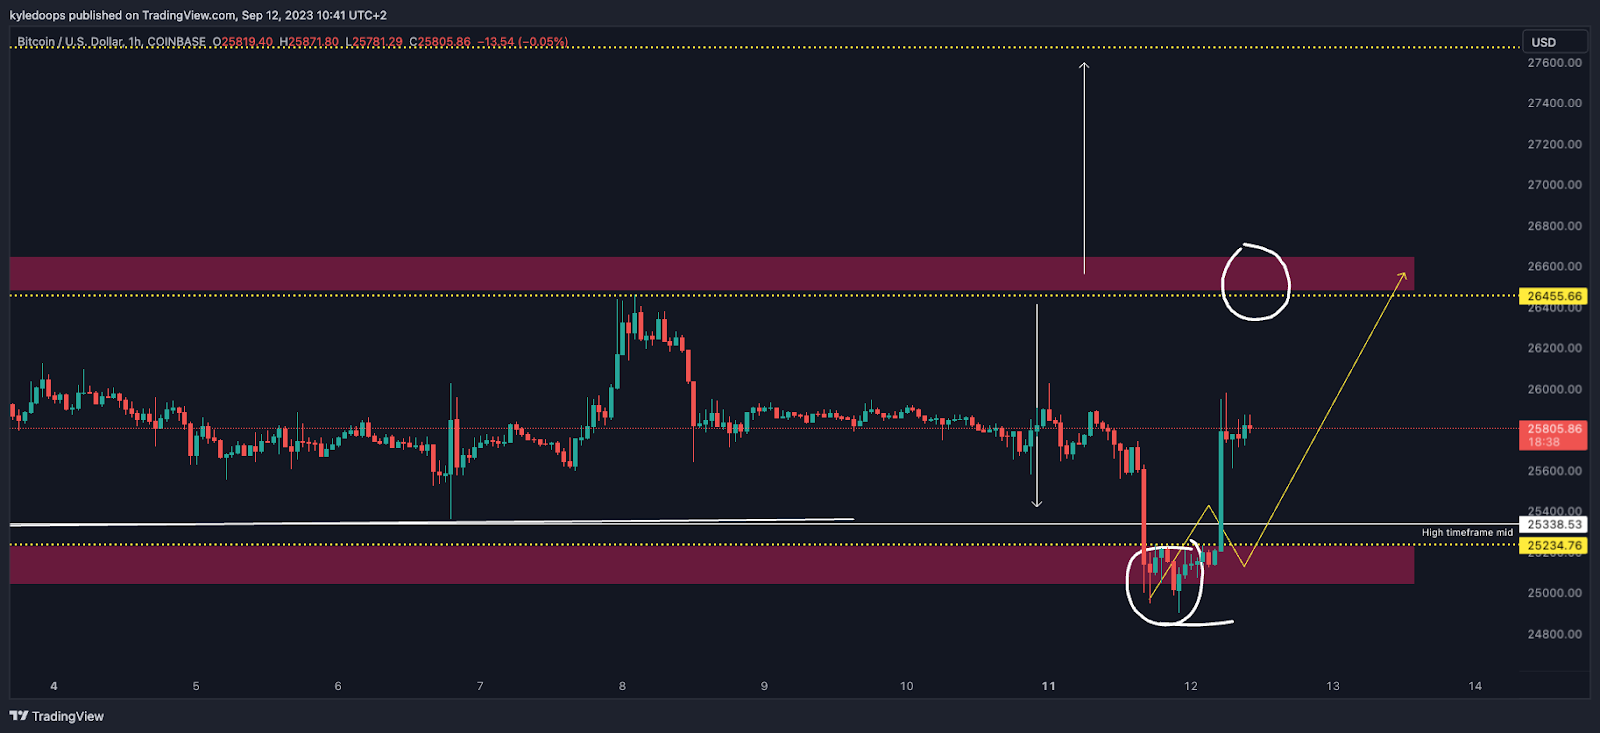
Chart #3 - Bitcoin (BTCUSD) Hourly Chart
Chartist: Kyle
(For the chart screenshot, click here.)
Bitcoin displayed the swing failure pattern and liquidity grab that was previously mentioned in The Daily Candle!
It swept past the low at $25,000 before re-entering the range.
Now that this has occurred, look for a continuation into the next pink box at $26,455. If it sustains above that level, Bitcoin might rise to $27,500. However, if it drops back below the $26,455 mark, we’ll consider playing it back down to the base of the range.
Claim your Bitget sign-up bonuses here (details below).
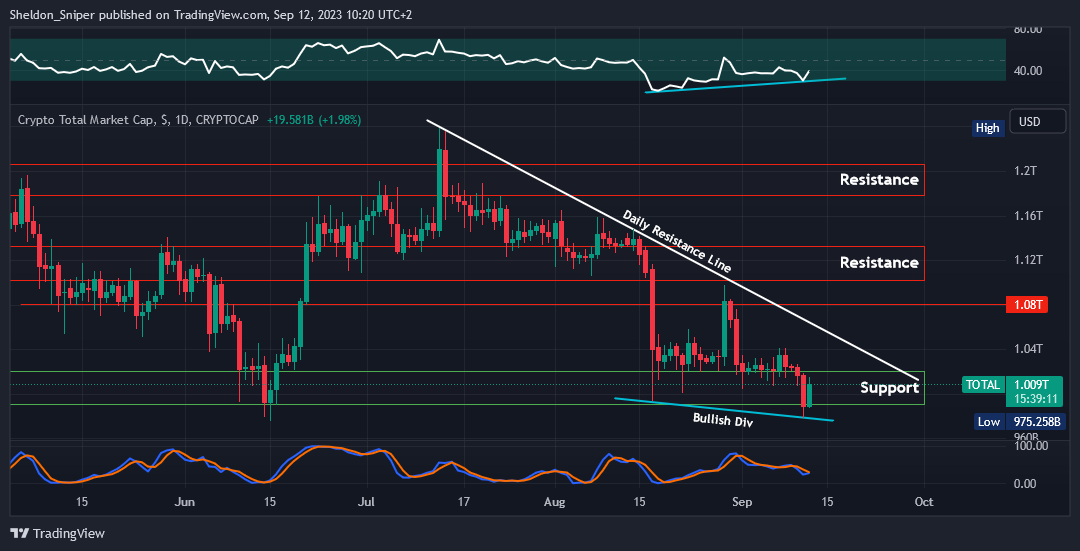
Chart #4 - Crypto Total Market Cap (TOTAL) Daily Chart
Chartist: Sheldon
(For the chart screenshot, click here.)
Yesterday, the TOTAL descended to test the $975B level, mirroring a similar test in mid-June.
This downward movement also resulted in a Bullish Divergence on the daily chart. Specifically, the Relative Strength Index (RSI) has been higher since around 17th August, even though the price dropped. This means the RSI did not confirm yesterday's downward shift, hinting at potential bullishness. This could lead the TOTAL to reverse its trend and climb.
Currently standing at $1.01T, the next resistance is closely situated at $1.025T. Surpassing that could likely send the TOTAL to $1.06T.
Claim your Bitget sign-up bonuses here (details below).
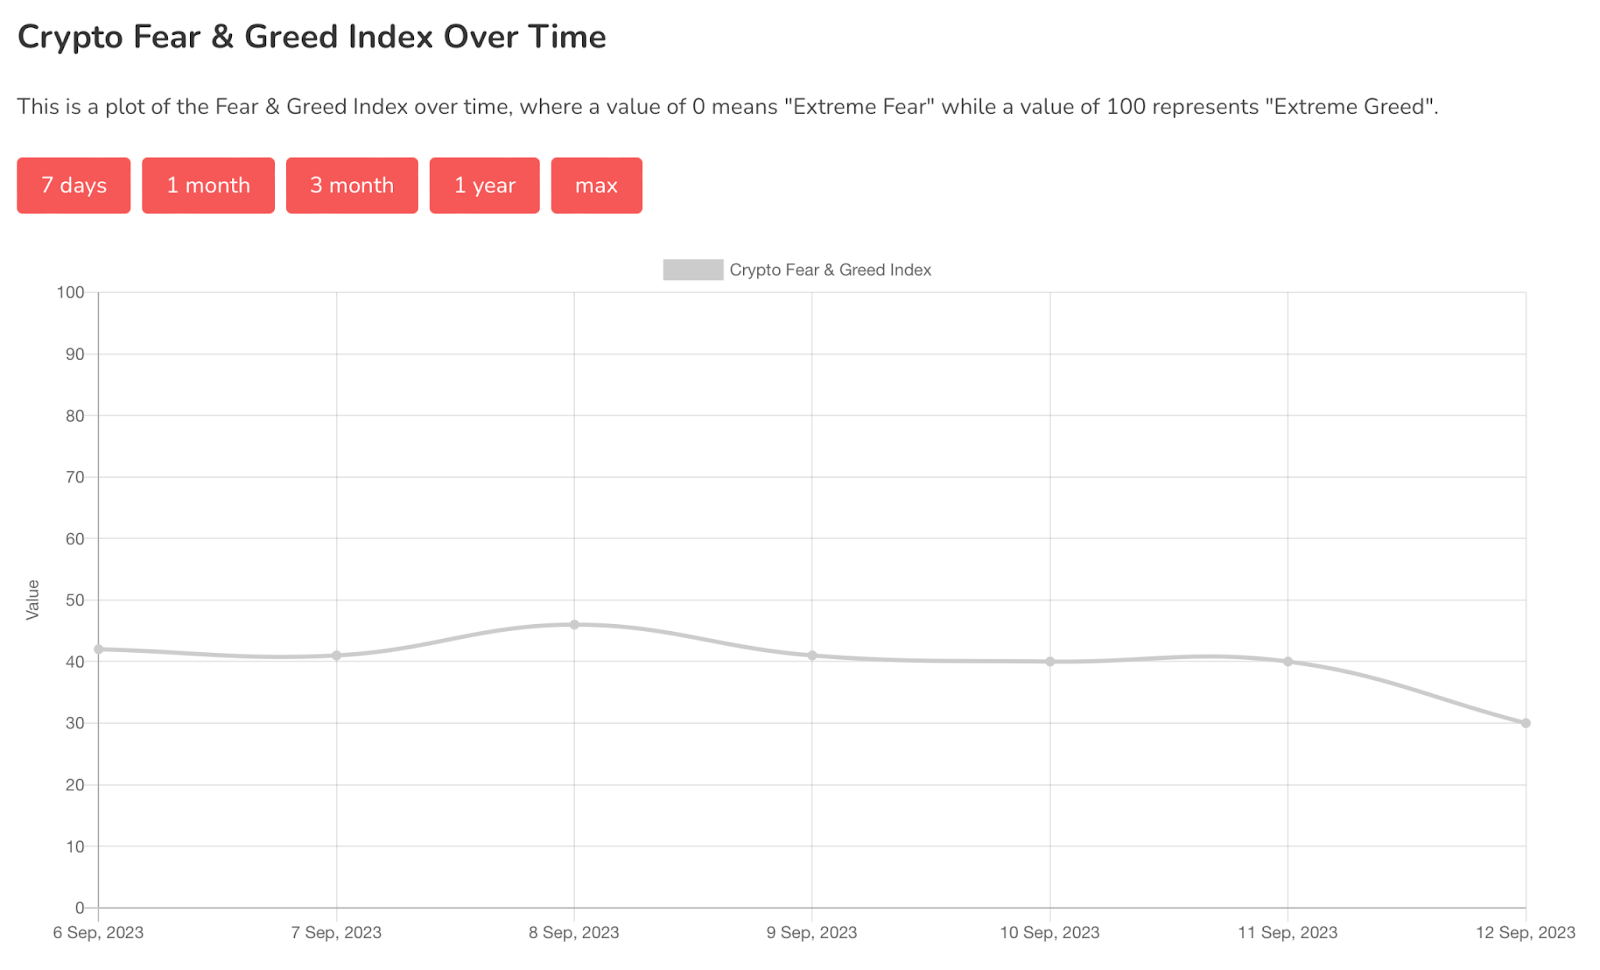
Chart #5 - Fear and Greed Index
The Fear and Greed Index is sitting at 30 today, indicating Fear.
The highest the index has been over the past seven days is 46, and the lowest is 30.
Banter’s Take
The illiquid market continues to be met with wild choppy price action, which makes for good range trading. The most conducive trades can be found on the hourly time frame, simply playing price between the range high and low.
Stay safe my friends!
Go to our Crypto Banter Discord here where Sheldon and Kyle give updates on the charts and trades from The Daily Candle newsletter!