

📈📉 What are bitcoin’s next moves? $AR gaining strength!
📈📉 What are bitcoin’s next moves? $AR gaining strength!

Sniper School
Sniper School kicks off a new cohort next week! What is Sniper School? Free 3-week trading course with Sheldon. You will learn how to trade like a pro in 3 short weeks and capitalize on the change in the markets.
There are only 3k seats and the waitlist is filling up fast! We still have some spots left for those that complete the entrance requirements of signing up for a fee exchange account and funding it. You’ll use it to trade live during the course.
The course includes weekly live workshops hosted by Sheldon, Mama Sniper, and special guests, plus daily live trading and market analysis sessions with our team of Sniper Mentors!
It’s not just a school. It really is the start of an incredible journey with our family of degens! Reserve your spot now by clicking here.
Bitget winner - 4262971718
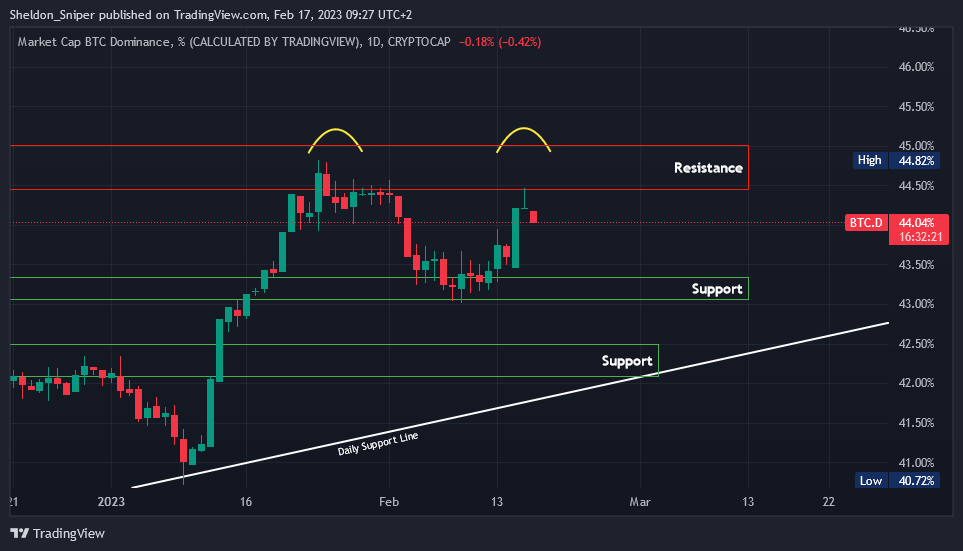
Chart #1 - Bitcoin Dominance (BTC.D) 1-Day Chart
Chartist: Sheldon
(For the chart screenshot, click here.)
Last night, bitcoin's price got rejected at $25,250 and fell almost $2,000 to $23,350. What was interesting is that Bitcoin Dominance simultaneously got rejected at resistance, dropping with BTC. That indicates cash was flowing out of BTC and into the altcoins.
This past week, BTC.D found support at around 43% before moving up to 44.5% (resistance), where it got rejected. That has created a double top - usually a bearish sign indicating a price reversal.
If BTC.D continues dropping, it could retest 43% (support), or even 42.5%, where its daily ascending support line from November sits. A further move down in Bitcoin Dominance will result in more cash moving out of BTC and into the altcoin market.
Check our Crypto Banter Discord here for updates!
Follow me on Twitter for urgent updates on my trading progress!
Claim your Bitget sign-up bonuses here (details below).
Chart #2 - Arweave (ARUSDT) 1-Day Chart
Chartist: Kyle

(For the chart screenshot, click here.)
Here's an update on the previous AR trade we looked at.
AR is once again coming right up against its mid-range level. The longer it grinds up against that level, the more likely it is to break out toward the range high, which could mean another massive move up.
Also, the longer it hangs around here, the more likely it will be that its EMAs have a chance to crawl up, creating additional momentum.
Check our Crypto Banter Discord here for updates!
Make sure to follow me on Twitter, where I will post updates on my trades as they unfold!
Claim your Bitget sign-up bonuses here (details below).

Last week we looked at Greeks in options trading. This week we will look at some more advanced options trading strategies. Please note that this is for educational purposes only.
Here are this week’s advanced options trading strategies:
SHORT STRADDLE:
Think of it like renting out a car. You rent out a car and charge a fee to the person who wants to rent it. If the person returns the car without any damages, you keep the fee as profit. But if the person returns the car with damages, you have to pay for the repairs. In the same way, if the stock price doesn't move much, you keep the premium as profit, but if the stock price moves a lot in either direction, you may have to pay out.
SHORT STRANGLE:
Think of it like renting out a specific type of car. Instead of renting out any car, you rent out a car that has specific features. In the same way, instead of selling a call and put with the same strike price, you sell a call and put with different strike prices, to profit from the stock price staying within a specific range.
DOUBLE DIAGONAL:
Think of it like renting out two cars at the same time. You rent out one car for a longer period of time, and another car for a shorter period of time. In the same way, you buy a long option with a further out expiration date, and sell an option with a closer expiration date and a different strike price. The goal is to benefit from time decay while also having some limited protection in case the stock price moves too much.
CASH-SECURED PUT:
Think of it like making a reservation at a restaurant. You make a reservation at a restaurant, and the restaurant agrees to give you a discount if you show up. In the same way, you receive a premium for selling a put option, and you have the cash on hand to buy the stock if the option is exercised. This can be a good strategy for those who believe a stock will go down in price and want to make a profit, or for those who are looking to buy a stock at a lower price and are willing to wait.
These are just a few examples of the many advanced options strategies out there.
Every single one of them has an associated use case for a specific situation. The complexity of all these strategies can vary from very basic ones to more advanced ones.
See you all next Friday for our next lesson on options trading!
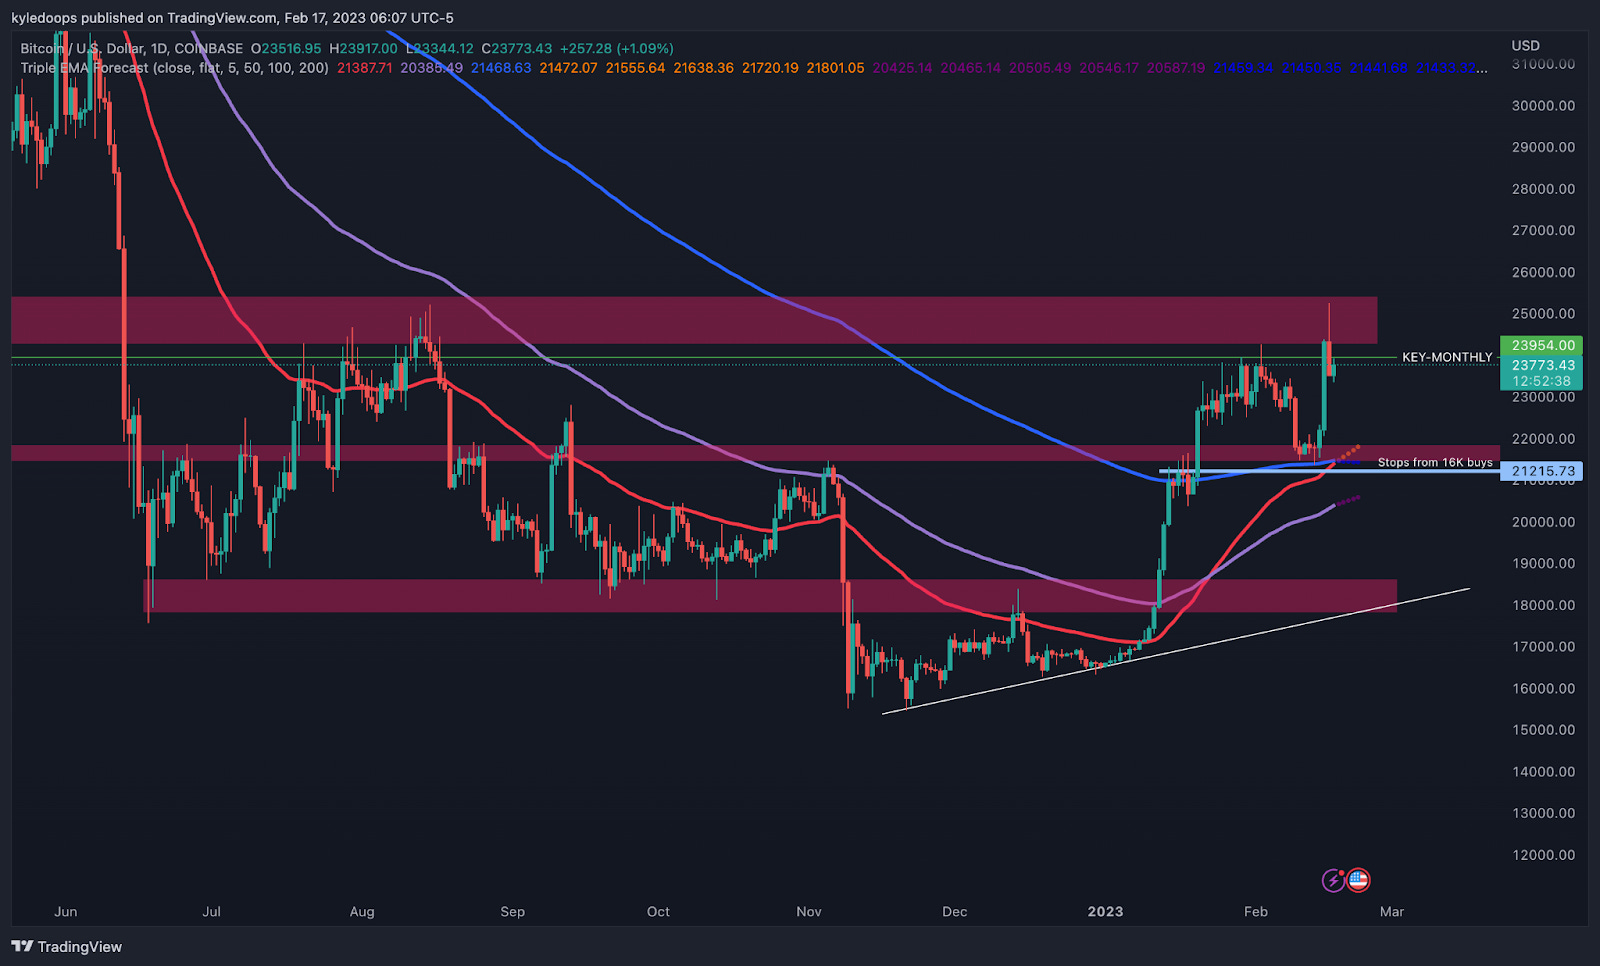
Chart #3 - Bitcoin (BTCUSD) 1-Day Chart
Chartist: Kyle
(For the chart screenshot, click here.)
Bitcoin had a failed breakout and has come back into its range - the same range which has governed the price since late June 2022.
What this means is failure to get back above soon will lead to lower prices, with the first area of interest being the 0.75% level of the overall range - aka $22,900. That could bring an opportunity to go long off another higher low and still give bulls the chance to get a trending run going, which could break out properly.
On the weekly chart, the 200-week moving average is where the price got rejected. Now, a convincing reclaim of the range highs and key monthly level would mean a second attempt to crack that 200-week MA.
Check our Crypto Banter Discord here for updates!
Make sure to follow me on Twitter, where I will post updates on my trades as they unfold!
Claim your Bitget sign-up bonuses here (details below).
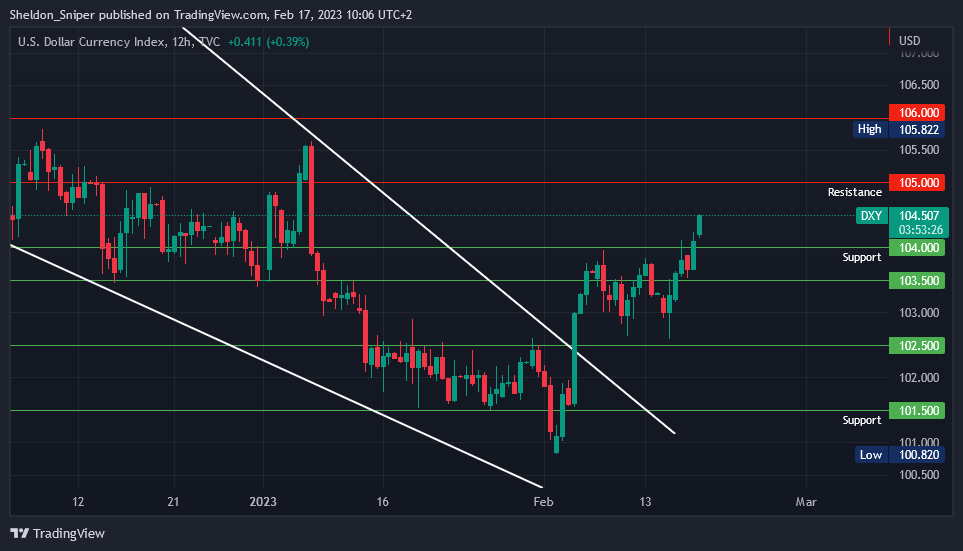
Chart #4 - DXY 12-Hour Chart
Chartist: Sheldon
(For the chart screenshot, click here.)
Last night the DXY broke the crucial 104 level of resistance, which resulted in cash moving out of the markets and into the US Dollar. We saw the US stock and crypto markets give up gains, with BTC dropping by 8%.
The DXY is currently at 104.50 (resistance), and there might be a rejection here that sees it retest the previous 104 resistance, which is now acting as support.
However, earlier in February, the DXY broke to the upside out of a falling wedge structure it had been in for five months. If it continues upwards, the next significant resistance levels are at 105 and 106.
Check our Crypto Banter Discord here for updates!
Follow me on Twitter to get all the updates on my personal trading progress!
Claim your Bitget sign-up bonuses here (details below).
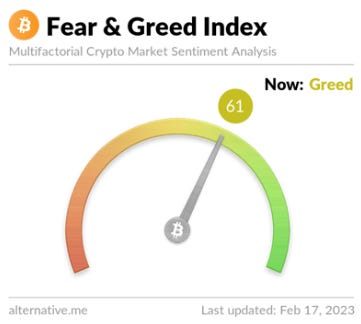
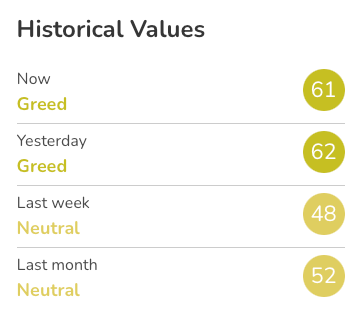
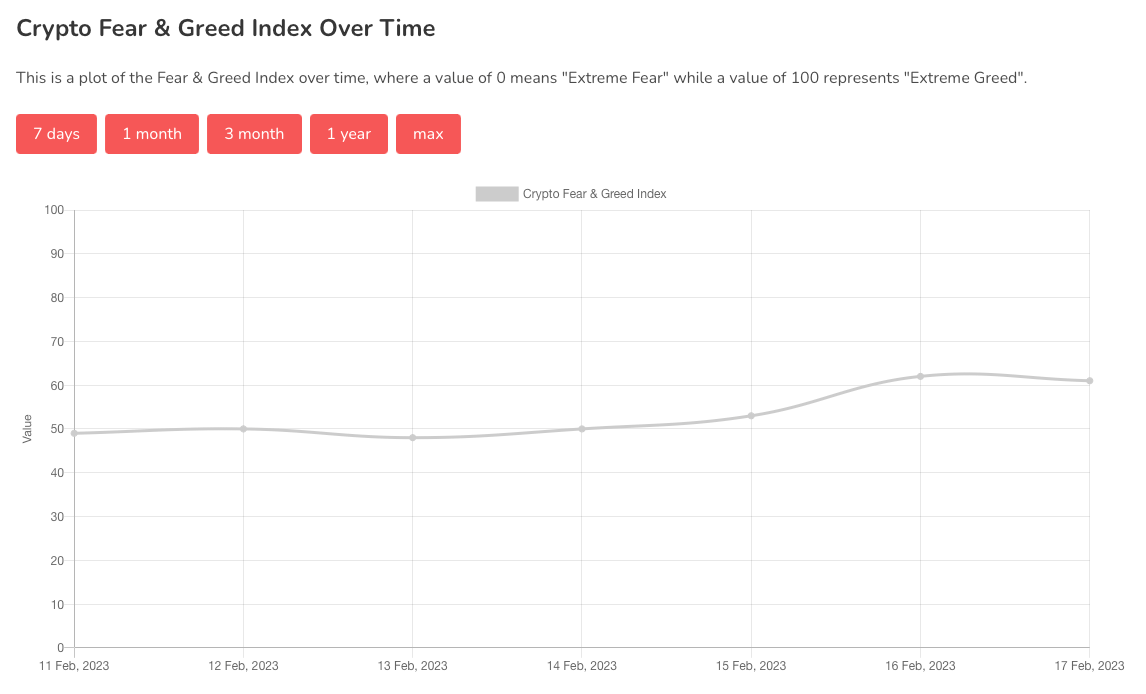
Chart #5 - Bitcoin Fear and Greed Index
The Bitcoin Fear and Greed Index is sitting at 61 today, indicating Greed.
The highest the index has been over the past seven days is 62, and the lowest is 48.
Overall Market Sentiment (Banter’s Take)
Do not be surprised if you see a massive altcoin rally over the weekend, as retail participants sit at home bidding the market, following what could be described as peak FOMO leading into the end of this week.
As always, we'll control our risk. That is achieved by reducing our position size and decreasing the amount of leverage we are using.
Stay safe my friends!
Bybit winner - 2744100