

What's Next For HEX and PulseChain?
What's Next For HEX and PulseChain?

Overview
Chart #1 - Render (RNDR/USDT) Daily Chart
Chart #2 - Hex (HEX/USDT) Daily Chart
Chart #3 - PulseChain (PLS/USDT) Daily Chart
Chart #4 - ChainLink (LINK/USDT) Daily Chart
Chart #5 - Fear and Greed Index

Chart #1 - Render (RNDR/USDT) Daily Chart
Chartist: Sheldon

RNDR has been very bullish for the first six months of the year, but over the last six weeks, the price of RNDR has once again retraced down to the three month range low around $1.60 - $1.75 which is a key support.
If price can hold in this area, there is a possibility of price once again rallying to the next major area of resistance at $2.00 - $2.25. To the downside, if there is a break of the current major range low area of support at $1.60, then the next major support is at $1.20 - $1.40.
I am still expecting the BTC dominance to push lower in the next couple of weeks, which will be bullish for the General Altcoin Market, including RNDR.
Sign-up and trade on Bybit today.
Exclusive $30,000 deposit rewards and bonuses up for grabs!
Chart #2 - Hex (HEX/USDT) Daily Chart
Chartist: Kyle

HEX USD has also made a new swing low on the daily timeframe which means that any push up into the red horizontal $0.004834 will likely lead to a rejection.
If that line gets cleared, then your next major rejection will likely be found at the declining yellow dashed line at $0.008897.
It will take many months for these coins to recover and even then, there is no guarantee of recovery.
𝗣𝗿𝗶𝗺𝗲 𝗫𝗕𝗧
Sign up for a new Trading Account on Prime XBT!
Receive a deposit bonus of up to $7,000 with promo code: KyleDoops

Sign up for a new Trading Account on Prime XBT!
Receive a deposit bonus of up to $7,000 with promo code: SheldonSniper
Chart #3 - PulseChain (PLS/USDT) Daily Chart
Chartist: Kyle

In light of the Richard Heart SEC saga, it seems fitting to chart Richard Heart’s tokens.
PLS has lost a very critical level, that level being 0.0000837, you can place your bets that price coming into that level again will likely lead to a major rejection and cause another deeper sell-off.
There is a lack of price history on this but from the history we do have, its not looking good. Its created a new swing low. Meaning the start of a stronger downtrend.
Claim your Bitget sign-up bonuses here (details below).
Chart #4 - ChainLink (LINK/USDT) Daily Chart
Chartist: Sheldon

LINK is also one of those altcoins that has been very bullish of late, and with the price of Link currently testing both the major $7.30 - $7.60 area of support and the Daily Ascending Support line, that is coming from the middle of June.
Price is oversold on the Daily time frame, and if there is a move to the upside, Link could once again test the $8.00 level of resistance, or even possibly the major $8.40 – 8.80 area of resistance.
If the Market sells off though, and both the $7.30 - $7.60 area of support, and the Daily Support line is lost, then the next area of support is coming in at around $6.70 - $7.00.
Claim your Bitget sign-up bonuses here (details below).
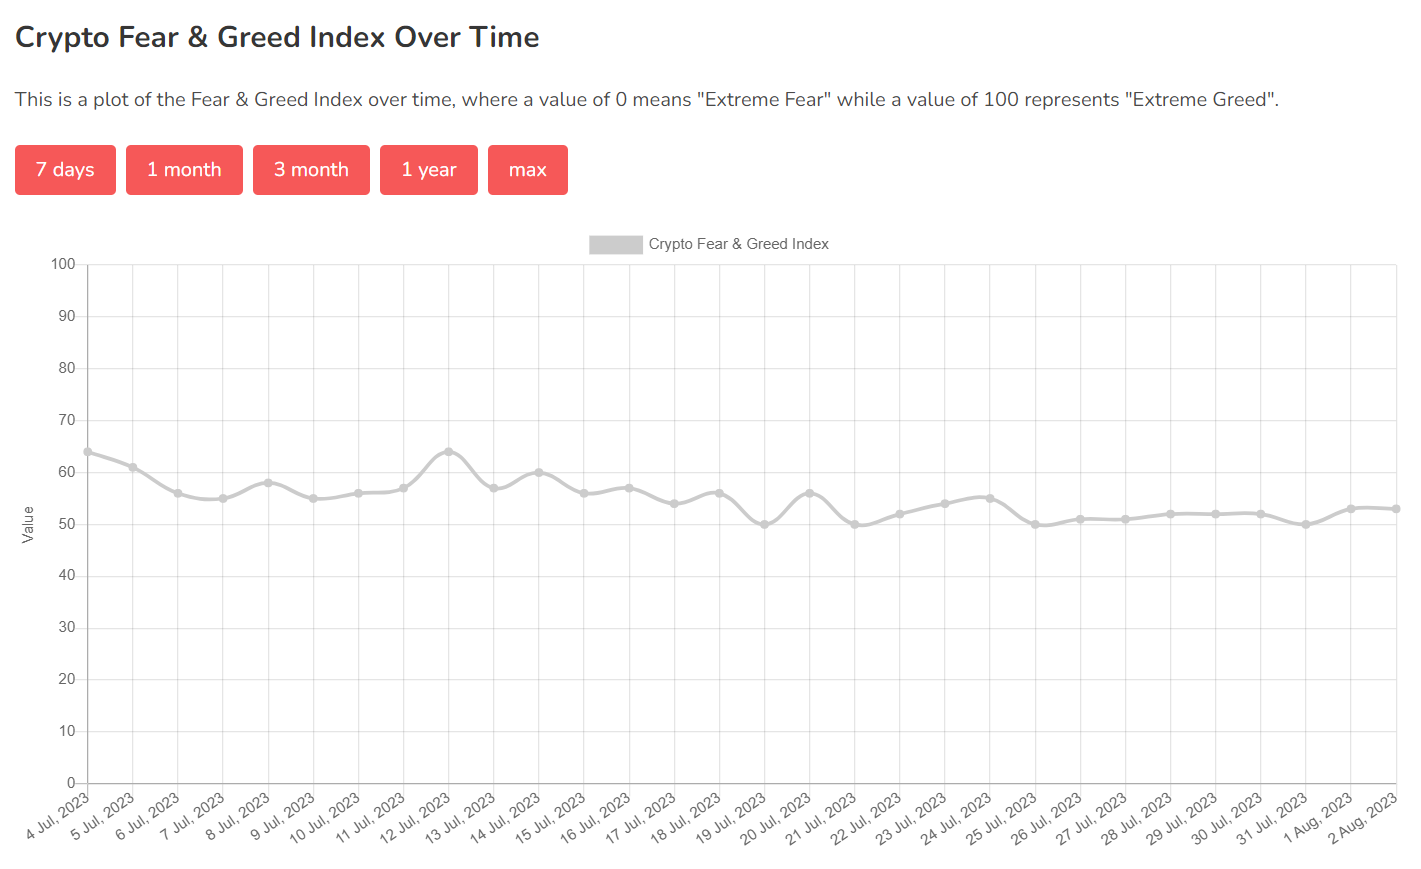
Chart #5 - Fear and Greed Index
The Fear and Greed Index is sitting at 53 today, Neutral.
The highest the index has been over the past seven days is 53, and the lowest is 50.
Banter’s Take
The recent Bitcoin pump needs to lead to another bounce off the 200 ema on the 4-hour and more importantly reclaim the 200 EMA at $29,600. A consolidation above $29,600 means price probably continues higher.