

📈📉 Will the Arbitrum airdrop send bitcoin to $32k?
📈📉 Will the Arbitrum airdrop send bitcoin to $32k?

Bitget winner - 3205943081
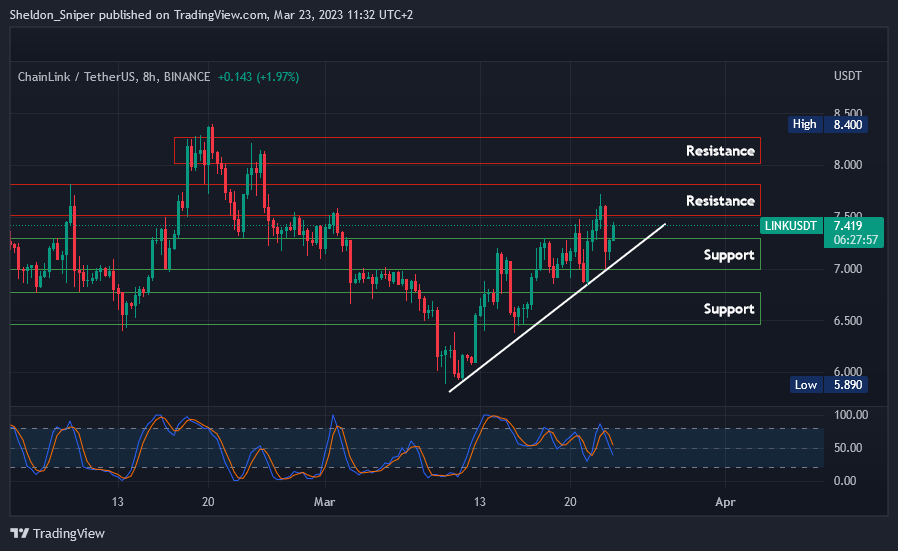
Chart #1 - Chainlink (LINKUSDT) 8-Hour Chart
Chartist: Sheldon
(For the chart screenshot, click here.)
After consolidating between $7.00 - $7.30, LINK is at $7.40, possibly getting ready to pump and test the next resistance levels at $7.50 - $7.75 and $8.00 - $8.30.
Dropping lower from here would take it to $6.50 - $6.75.
𝗣𝗿𝗶𝗺𝗲 𝗫𝗕𝗧
Sign up for a new Trading Account on Prime XBT!
Receive a deposit bonus of up to $7,000 with promo code: SheldonSniper
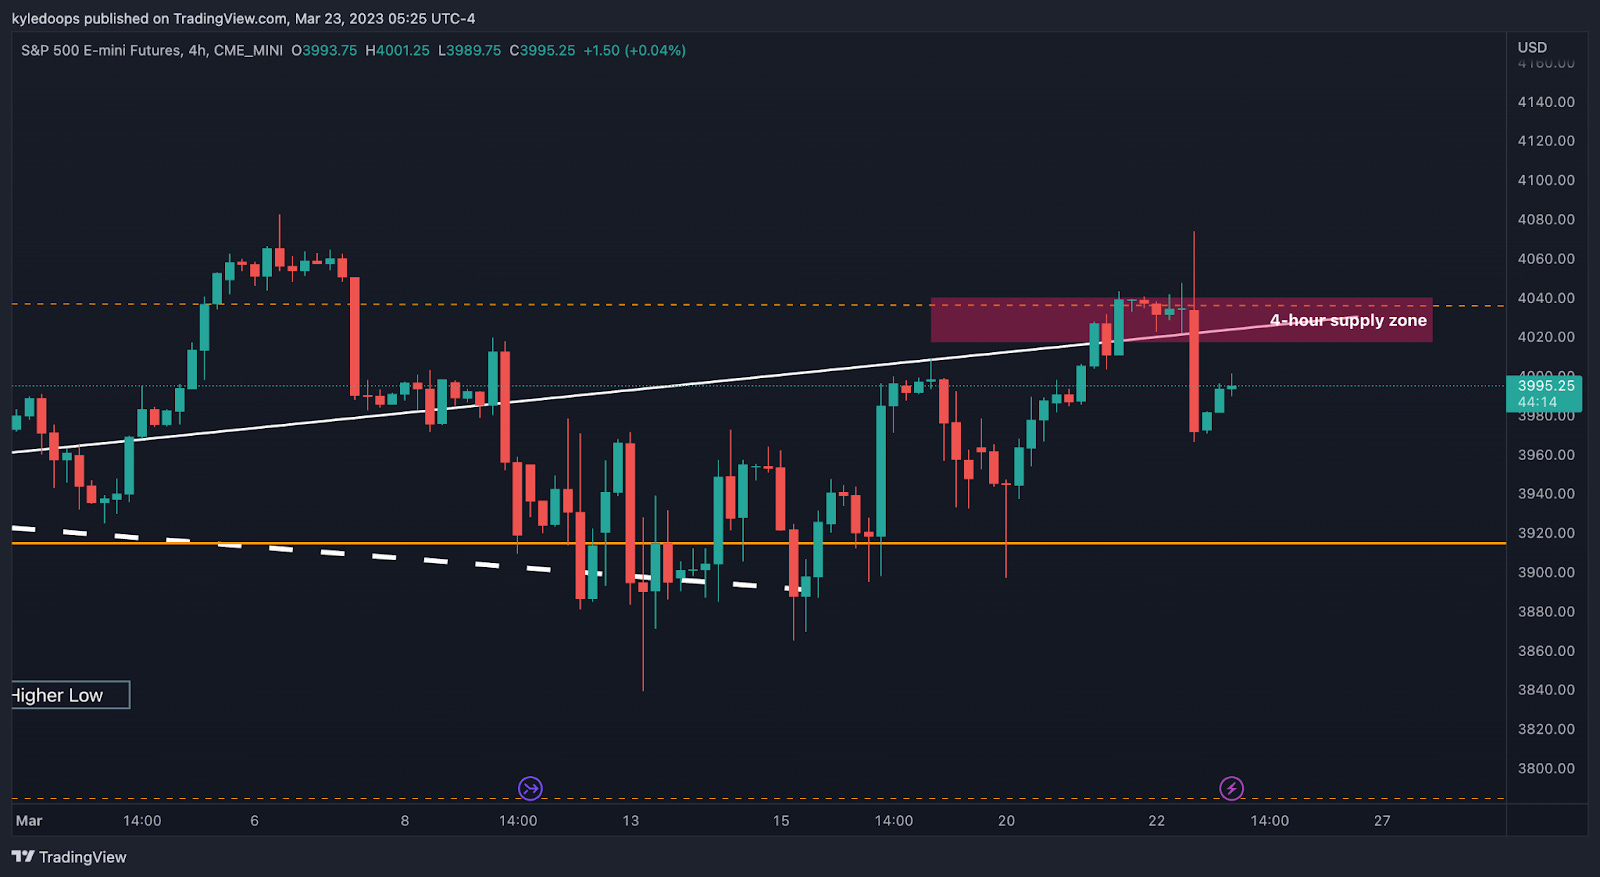
Chart #2 - S&P 500 4-Hour Chart
Chartist: Kyle
(For the chart screenshot, click here.)
We need to keep an eye on the pink box labeled the 4-hour supply zone.
A rejection from there would mean a possible trend shift, and the S&P 500 would sell off further, creating a lower high. That would affect the crypto market and dictate whether bitcoin starts distributing or not.
If the S&P 500 can clear that level, expect bitcoin to push up to $30,000 - $32,000.
𝗣𝗿𝗶𝗺𝗲 𝗫𝗕𝗧
Sign up for a new Trading Account on Prime XBT!
Receive a deposit bonus of up to $7,000 with promo code: KyleDoops
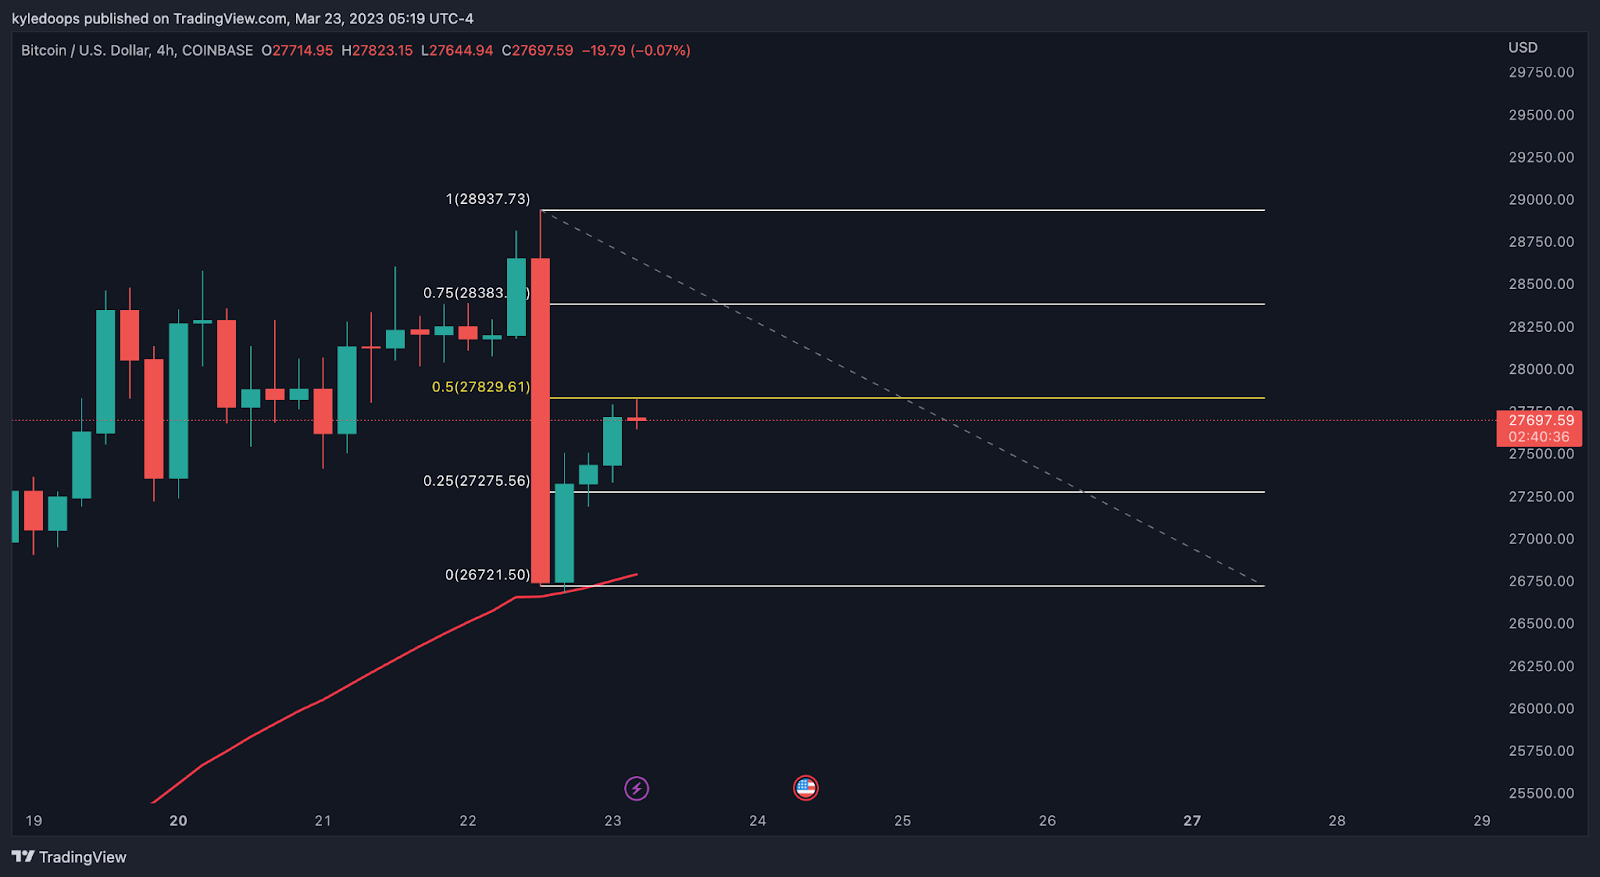
Chart #3 - Bitcoin (BTCUSD) 4-Hour Chart
Chartist: Kyle
(For the chart screenshot, click here.)
Bitcoin had a massive daily move yesterday, bouncing off the 50 EMA on its 4-hour chart.
Using the Fib tool, we can mark out the key range levels so that we know where we stand. If we take the Fib from the candle low to the candle high, we can see that the price is rejecting off of the mid-range Fib level.
If it can get above that level, we'll have to watch the 0.75 level (75% of the way through the range) to make sure bitcoin doesn't set a lower high there. If it does, we may need to exit our positions, because if the daily low gets taken out, a local top will occur, and distribution is the next most likely scenario.
If that happens, then look to the 200 EMA on the 4-hour as the next potential bounce level.
Claim your Bitget sign-up bonuses here (details below).
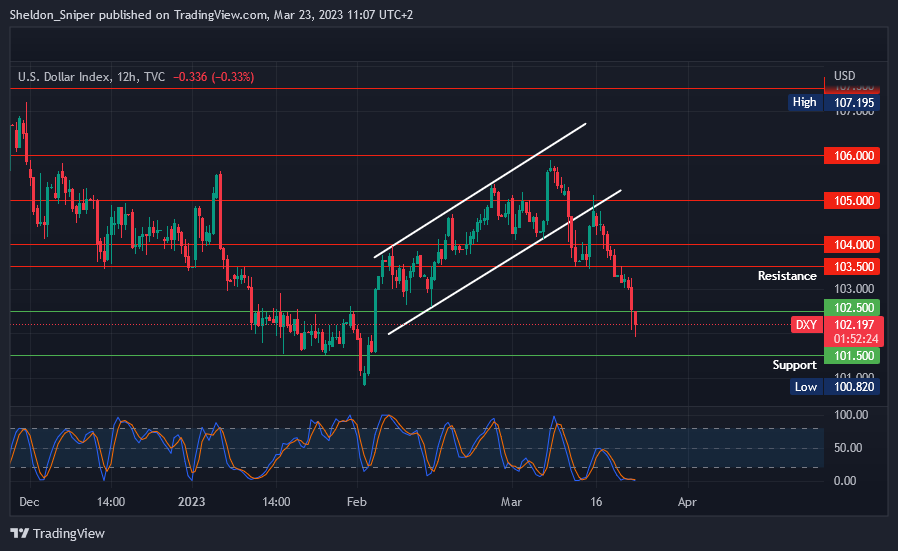
Chart #4 - DXY 12-Hour Chart
Chartist: Sheldon
(For the chart screenshot, click here.)
The DXY has dropped to 102.00, which held nicely back in January. It may now repeat the pattern.
Medium to long timeframe chart indicators are oversold, so the DXY may consolidate here for a while unless it decides to head straight back up. Heading higher will take it to 103.50 - 104.00 (resistance).
Critical support lies between 101.50 - 102.50.
Claim your Bitget sign-up bonuses here (details below).
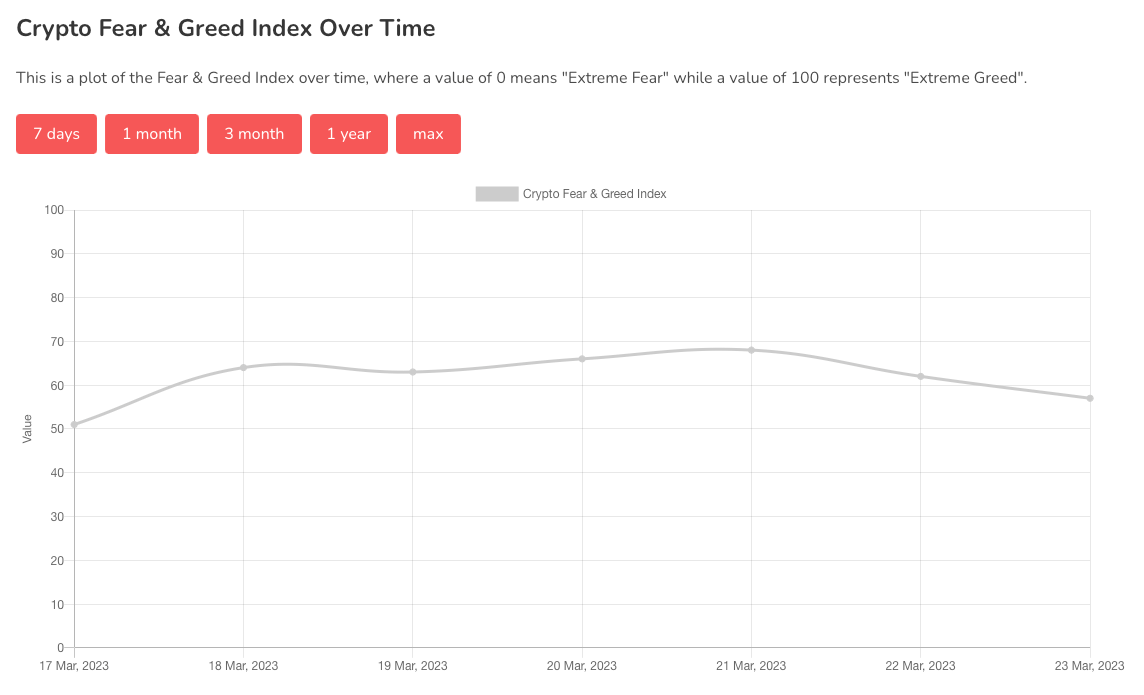
Chart #5 - Bitcoin Fear and Greed Index
The Bitcoin Fear and Greed Index is sitting at 57 today, indicating Greed.
The highest the index has been over the past seven days is 68, and the lowest is 51.
Overall Market Sentiment (Banter’s Take)
If the massive BLUR airdrop that took place a few months back is anything to go by, today's Arbitrum (ARB) airdrop could give crypto one more push up, taking bitcoin into the $30,000 - $32,000 supply zone.
Either way, bitcoin is approaching critical resistance, and a deeper pullback is inevitable, whether from $28,000 or slightly higher.
Stay safe my friends!
Go to our Crypto Banter Discord here where Sheldon and Kyle give updates on the charts and trades from The Daily Candle newsletter!
Bybit winner - 1067701274