

📈📉 Will the DXY cause a pullback today? NEAR could soar soon!
📈📉 Will the DXY cause a pullback today? NEAR could soar soon!

Bitget winner - 6065005875
Wondering what that 👆 is and how you can win? Then check out our daily shows on YouTube!
Are you using Bybit instead? Then look for the winning Bybit account below. But if you want to double your chances of winning, sign up today to both exchanges with the links found in the description of our YouTube videos!
Good luck to all!
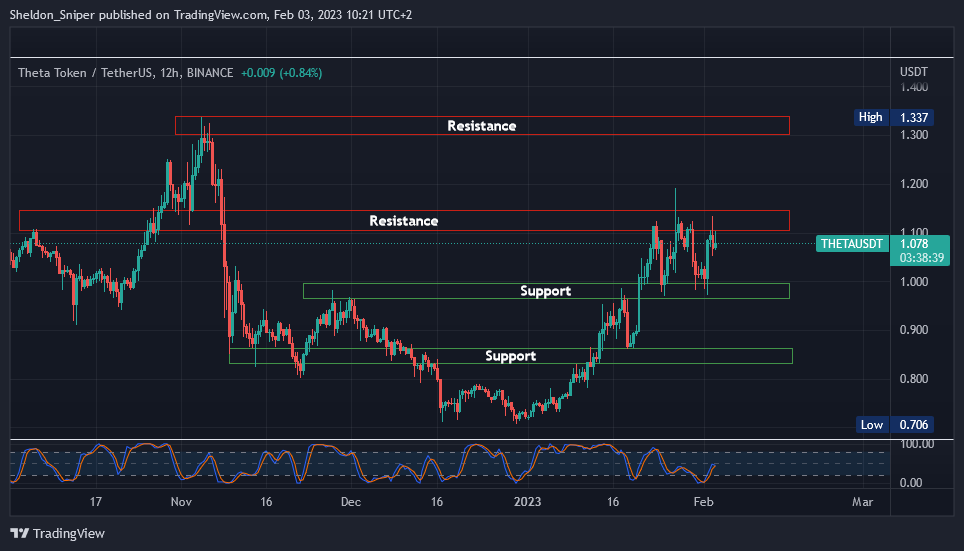
Chart #1 - Theta Network (THETAUSDT) 12-Hour Chart
Chartist: Sheldon
(For the chart screenshot, click here.)
THETA has jumped 40% in four weeks, from $0.70 to just below $1.10, and has been trading between $1 and $1.10 over the past week, potentially getting ready to push higher in the next few days (if BTC and stocks co-operate).
If THETA breaks $1.10, it should test the next area of resistance around $1.30. And if it retraces from here, breaking below $1.00, the next level of support is at $0.85.
THETA hasn't moved as much as some other similar alts (in the past four weeks) and could see a leg up soon.
Check our Crypto Banter Discord here for updates!
Follow me on Twitter for urgent updates on my trading progress!
Claim your Bitget sign-up bonuses here (details below).
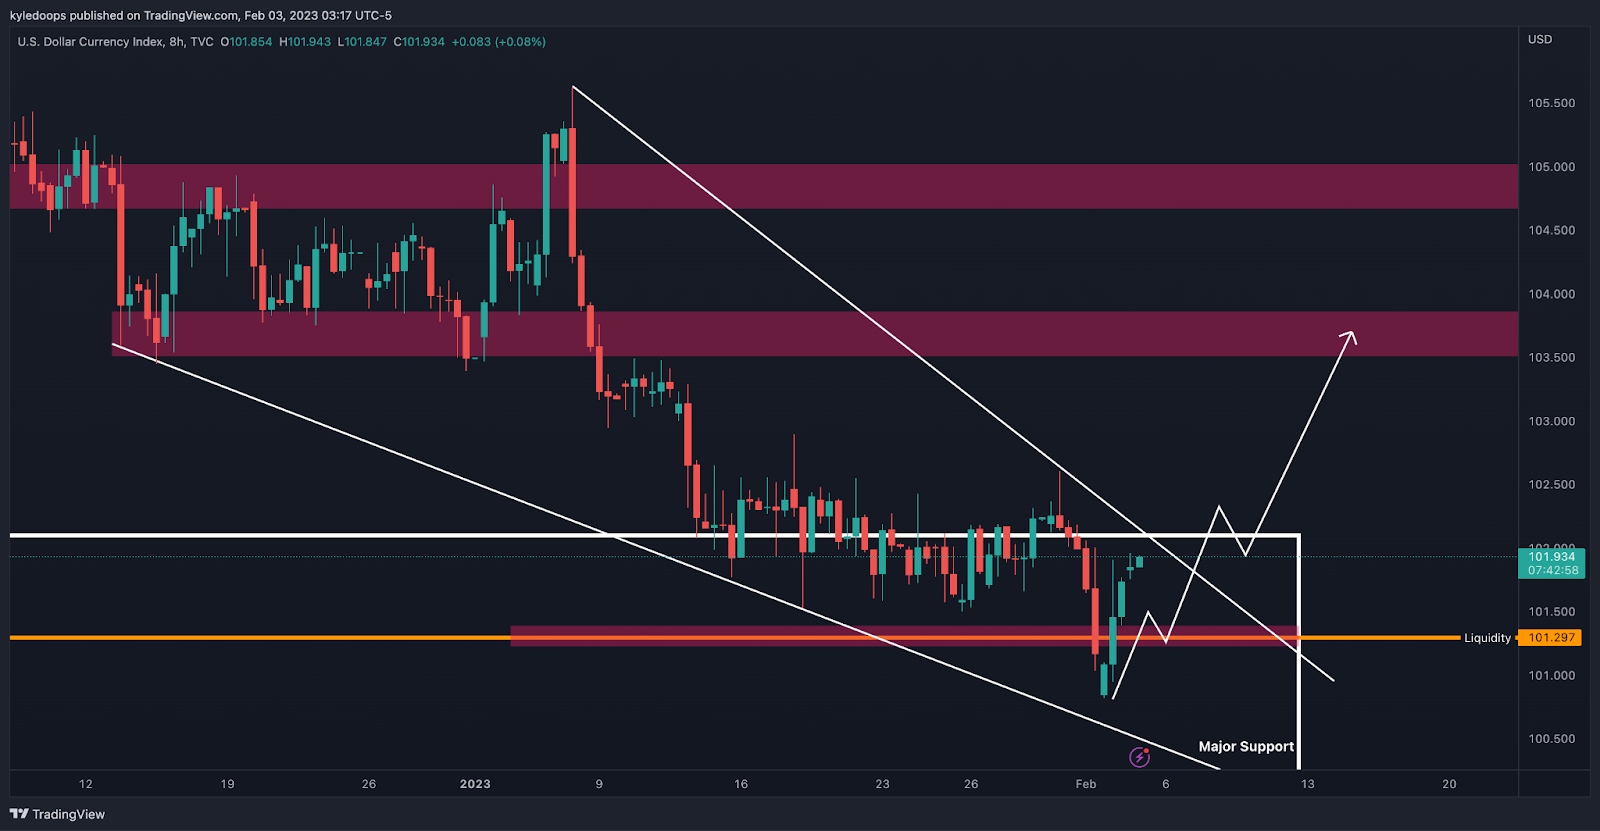
Chart #2 - DXY 8-Hour Chart
Chartist: Kyle
(For the chart screenshot, click here.)
Here's an update on the DXY, as I posted it yesterday and it is playing out just as expected.
If the DXY breaks out today, both the stock and crypto markets are likely to pull back. I believe bitcoin would catch support between $21,000 and $22,000.
Once the breakout occurs, I'll look toward 103.5 for a lower high. If that lower high forms, it's game on for crypto to rally off of its first significant higher low.
Check our Crypto Banter Discord here for updates!
Make sure to follow me on Twitter, where I will post updates on my trades as they unfold!
Claim your Bitget sign-up bonuses here (details below).

Last week we talked about some Basic Options strategies and their uses. This week, we'll look at advanced Option Strategies. Please note that this is for educational purposes only.
We will go over each of these strategies in detail in the future with examples to explain them even better.
Here are some advanced Options trading strategies:
Bull Call Spread - Think of it like betting on a horse race. You're betting on a horse to win, but you're also hedging your bet by betting on another horse just in case the first one doesn't do as well as you expect. That's basically what a bull call spread is. You're buying one call option that gives you the right to buy a stock at a certain price (your "horse to win"), and then selling another call option at a higher price to help pay for it.
Bear Put Spread - This is like betting on a horse race, but in reverse. You're betting on a horse to lose, but also hedging your bet by betting on another horse to do better in case your first pick doesn't do as badly as you expect. You're buying one put option (betting the stock price will go down), and selling another put option at a lower price to offset some of the cost.
Long Calendar Spreads - Imagine you're buying a concert ticket, but the concert is in six months. You're betting the concert will be good, but what if there's a chance it gets postponed or canceled? That's where a long calendar spread comes in. You're combining a long-term bullish outlook (the concert will be good) with a near-term neutral/bearish outlook (what if it gets postponed or canceled?).
Trading Protective Puts - This is like buying insurance for your stock. Let's say you own a car, and you don't want to take any chances of it getting damaged. You buy insurance to protect yourself in case anything happens. That's what a protective put is. You're adding a long put position (insurance) to a long stock position (the car). This way, if the stock price goes down, your put option will increase in value and offset the loss in your stock.
These are just a few examples of the many Options strategies out there.
Every single one of them has an associated use case for a specific situation. The complexity of all these strategies can vary from very basic ones (like buying a naked call), to more advanced ones like the Short Iron Condor, which profits if the underlying stock is inside the inner zones at expiration.
For anyone who wishes to try Options trading, the best first step could be to practice paper trading by watching the price action of a naked call or put and comparing the price action of the option to the underlying stock.
This will also be our next segment in the Options series - Greeks in Options Trading.
See you all next Friday for our next lesson on Options trading!
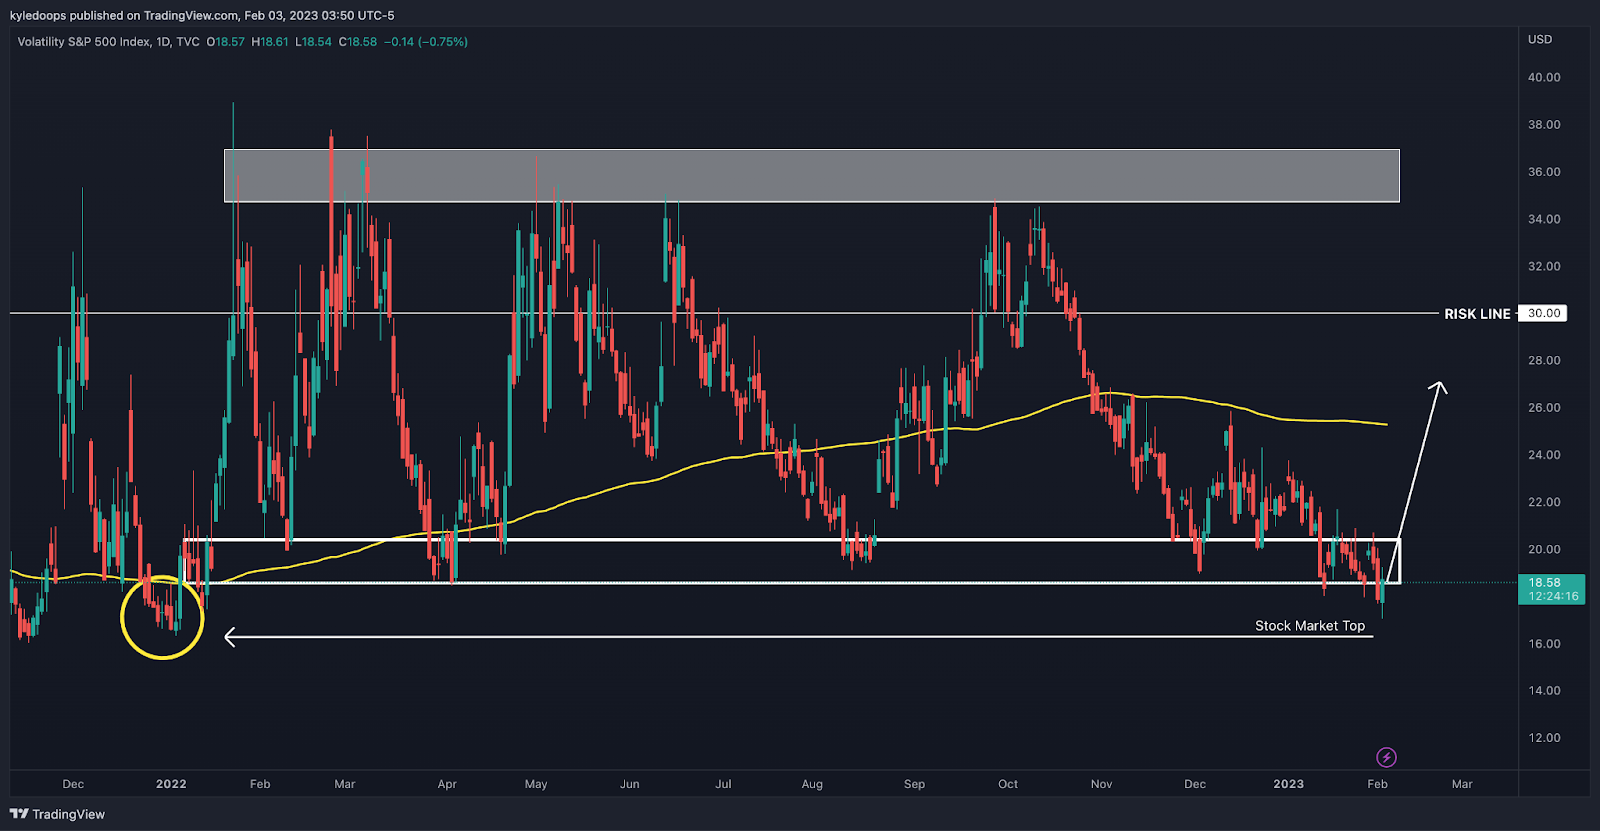
Chart #3 - VIX 1-Day Chart
Chartist: Kyle
(For the chart screenshot, click here.)
The VIX is bouncing from a crucial level, which coincides with what I see on the DXY...
In the scenario that they both bounce simultaneously, the pull-back could take place.
The last time the VIX squeezed this low was at the top of the 2021 stock market rally.
Check our Crypto Banter Discord here for updates!
Make sure to follow me on Twitter, where I will post updates on my trades as they unfold!
Claim your Bitget sign-up bonuses here (details below).
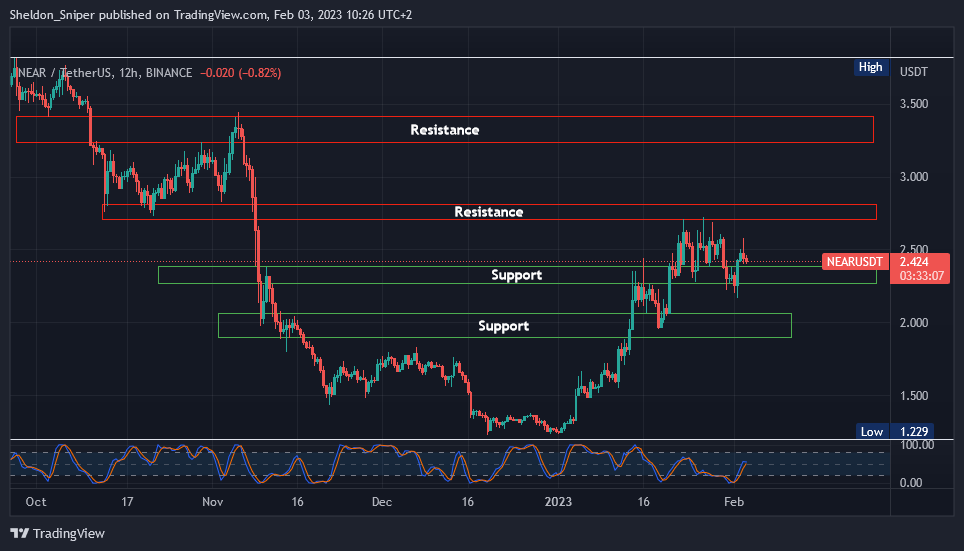
Chart #4 - NEAR Protocol (NEARUSDT) 12-Hour Chart
Chartist: Sheldon
(For the chart screenshot, click here.)
NEAR had a nice run that started in January, going up by around 120%, from $1.23 to $2.70, where it hit resistance a few days ago. It has since retraced and came down to support at $2.35, where it is consolidating.
NEAR could be preparing to test resistance at $2.70 again, with the potential of ripping through and heading to $3.40.
But, if it fails to do so and loses $2.35 (support), NEAR could visit the $2.00 level.
I feel confident about NEAR. It potentially has a lot of upside coming over the next few weeks. Let's not forget it was trading at $20 last April.
Check our Crypto Banter Discord here for updates!
Follow me on Twitter to get all the updates on my personal trading progress!
Claim your Bitget sign-up bonuses here (details below).
Bybit winner - 2761798
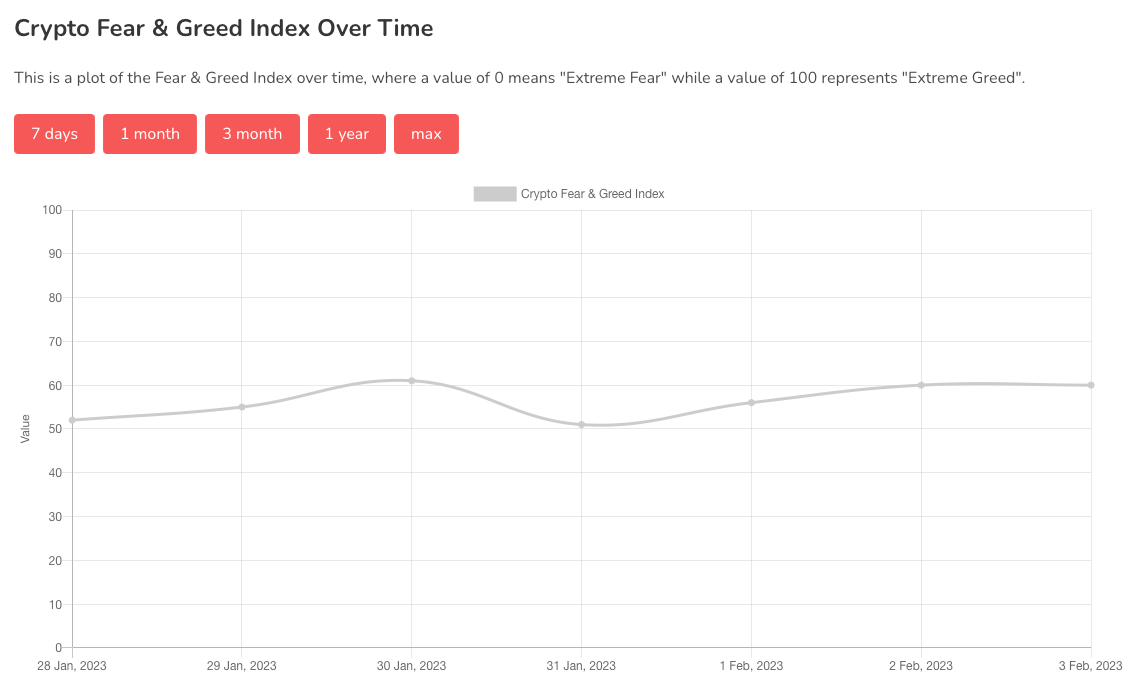
Chart #5 - Bitcoin Fear and Greed Index
The Bitcoin Fear and Greed Index is sitting at 60 today, indicating Greed.
The highest the index has been over the past seven days is 61, and the lowest is 51.
Overall Market Sentiment (Banter’s Take)
Altcoins are rallying nicely, and as long as bitcoin can maintain above the $23,000 level, they should continue to rally. If bitcoin pulls back over the weekend, the same levels are relevant - the $22,000 level is the first area of support.
Stay safe my friends!