

📈📉 Will the DXY ruin the rally? Or is bitcoin about to launch up to $25k?
📈📉 Will the DXY ruin the rally? Or is bitcoin about to launch up to $25k?

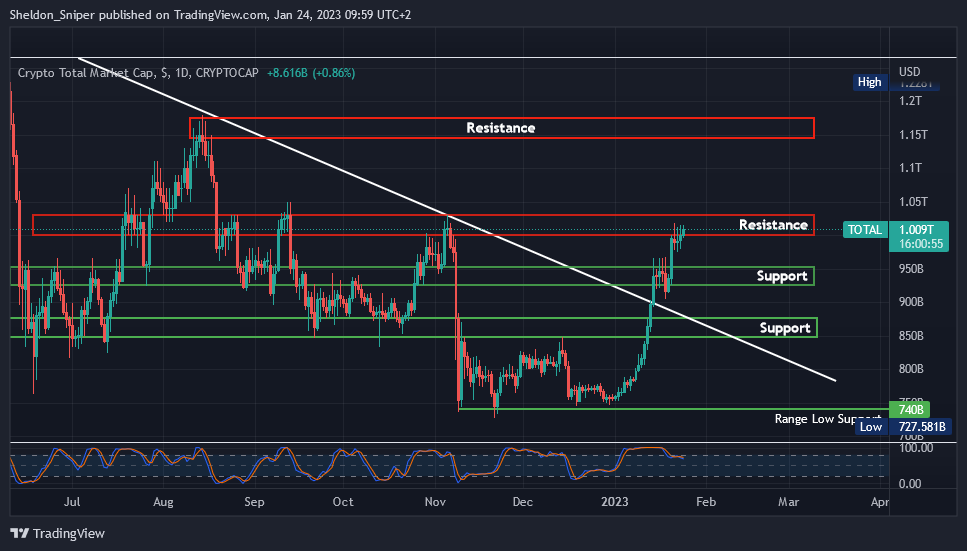
Chart #1 - Crypto Total Market Cap (TOTAL) 1-Day Chart
Chartist: Sheldon
(For the chart screenshot, click here.)
The TOTAL is currently at the major $1 Trillion area of resistance.
Even though the market is overheated, it does not mean that the TOTAL cannot move higher from here. If it breaks the $1T resistance zone, there is a possibility $1.15T is tested (next resistance). But if it gets rejected here, the next major area of support is around $950B.
The TOTAL has moved by $260B (35%) in the past three weeks, and we are due a pullback soon, so there is added risk in the market which traders need to manage accordingly.
Check our Crypto Banter Discord here for updates!
Follow me on Twitter for urgent updates on my trading progress!
Claim your Bitget sign-up bonuses here (details below).
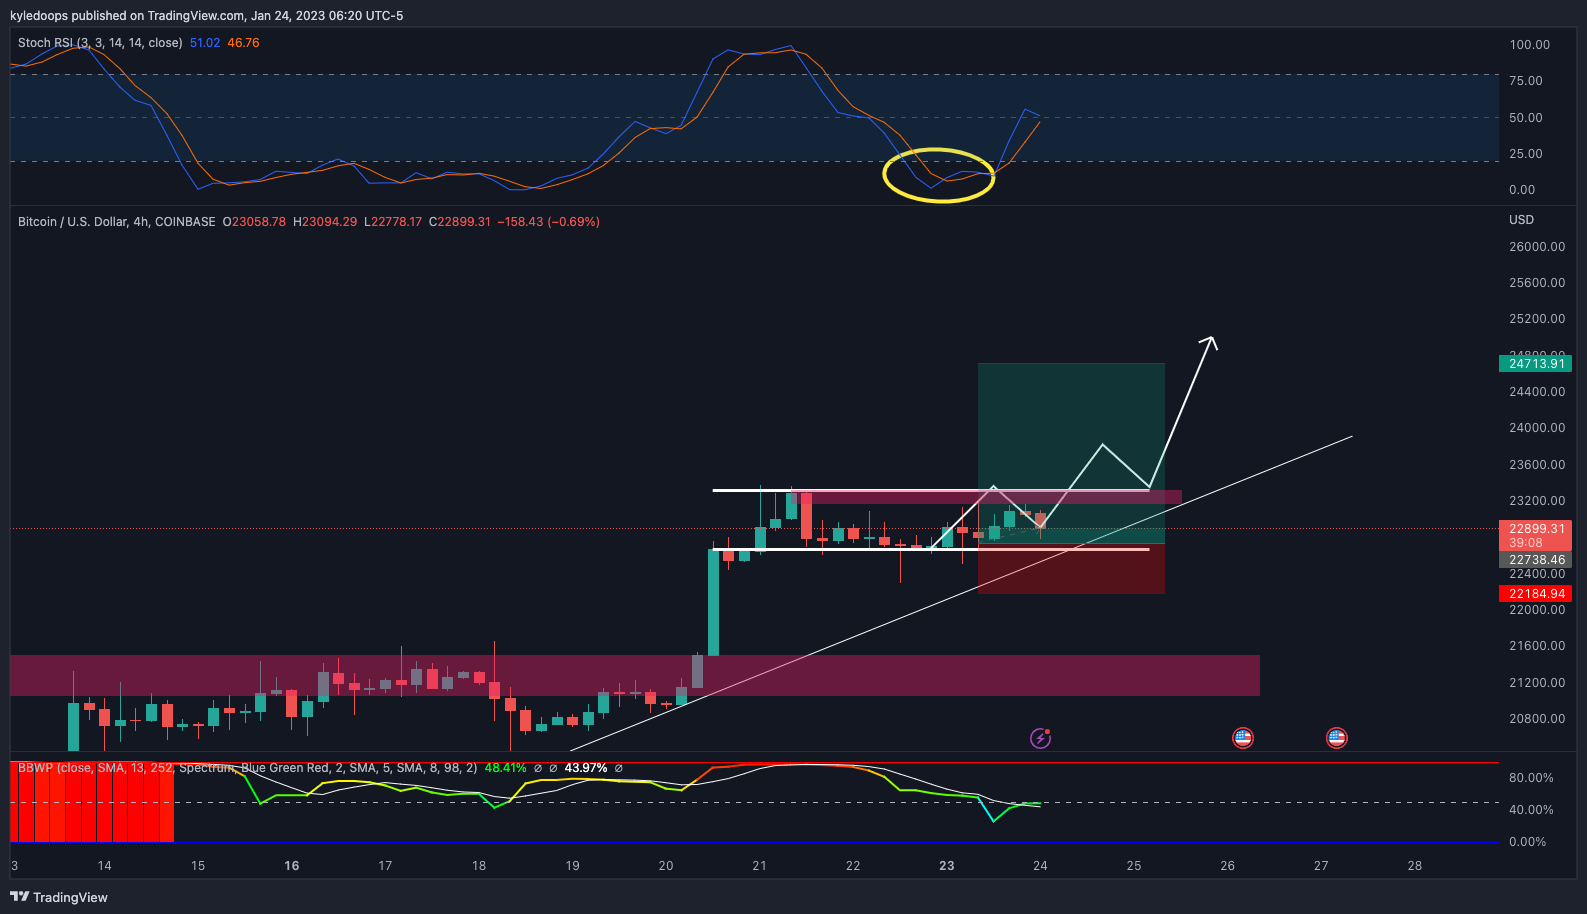
Chart #2 - Bitcoin (BTCUSD) 4-Hour Chart
Chartist: Kyle
(For the chart screenshot, click here.)
Bitcoin is consolidating after a big move in the same way it did for the past few weeks.
If the pattern plays out like the rest, I'll treat it as a bull flag, meaning the consolidation likely leads to a breakout with a measured move up to $25,000 (which also happens to be the range-high on the daily).
If bitcoin begins pulling back, the next level which must hold - if bulls want to retain control - is $21,000 - $21,500. The price would need to bounce quickly off that level, or a bull trap becomes a possibility.
Check our Crypto Banter Discord here for updates!
Make sure to follow me on Twitter, where I will post updates on my trades as they unfold!
Claim your Bitget sign-up bonuses here (details below).
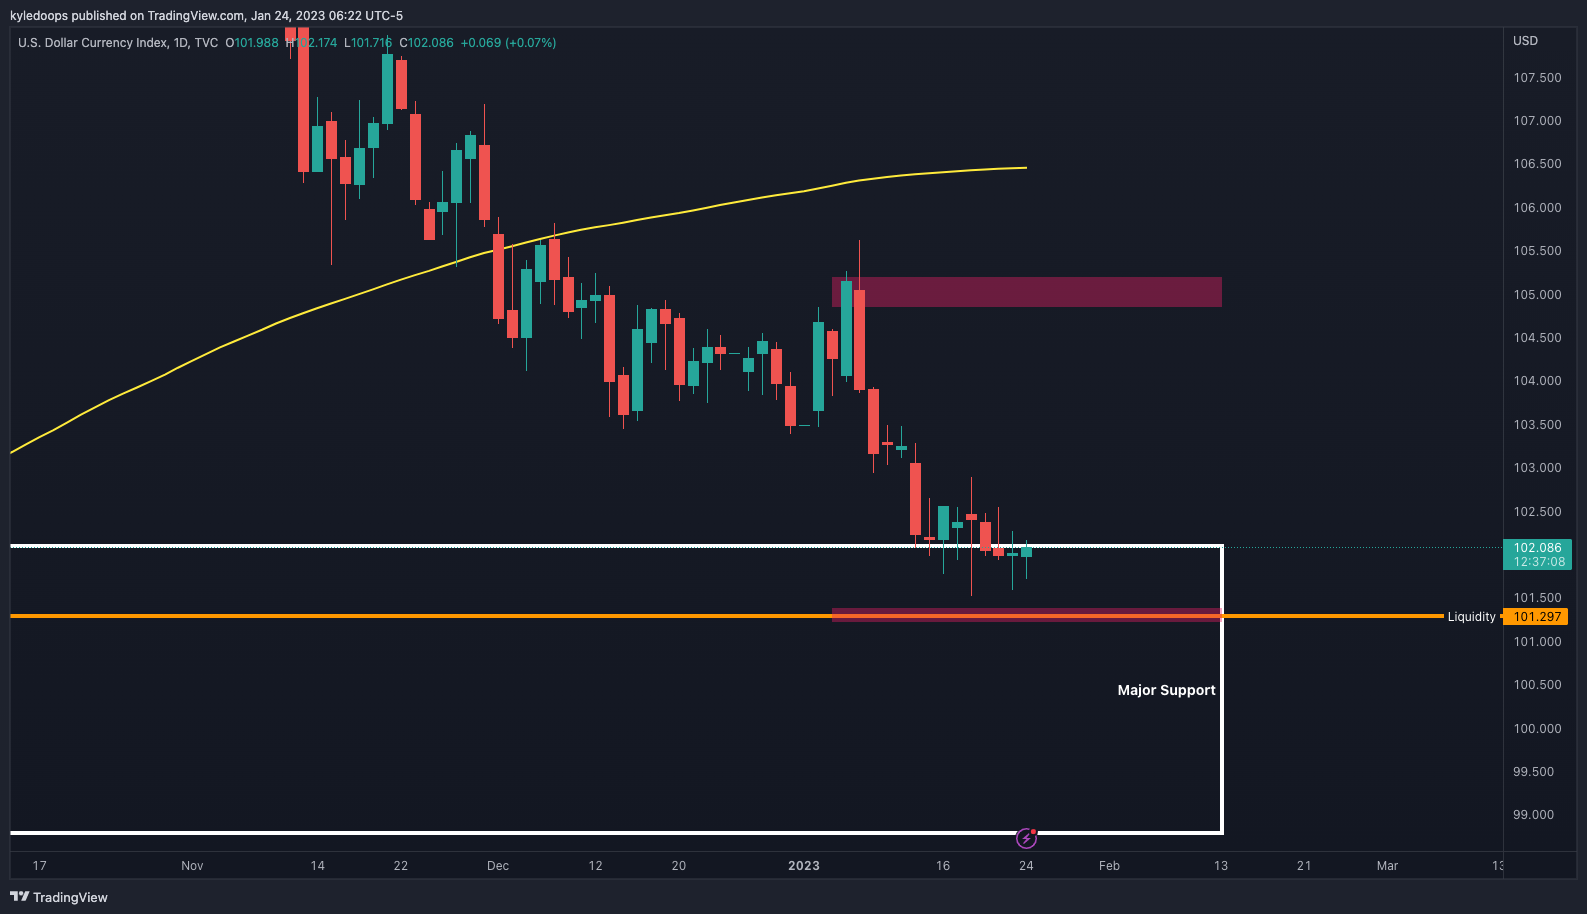
Chart #3 - US Dollar Currency Index (DXY) 1-Day Chart
Chartist: Kyle
(For the chart screenshot, click here.)
The DXY could easily ruin the equity and crypto rally with a strong bounce.
The area to mark off is 101.297, which will be a reactionary zone once tagged and, as the chart suggests, we are very close to that level. Since it (mostly) trades inversely to stocks, it would also create a trapping scenario for the bulls who are viewing the S&P 500 as having broken out of a year-long downtrend.
Check our Crypto Banter Discord here for updates!
Make sure to follow me on Twitter, where I will post updates on my trades as they unfold!
Claim your Bitget sign-up bonuses here (details below).
Winning Bybit UID - 27309296
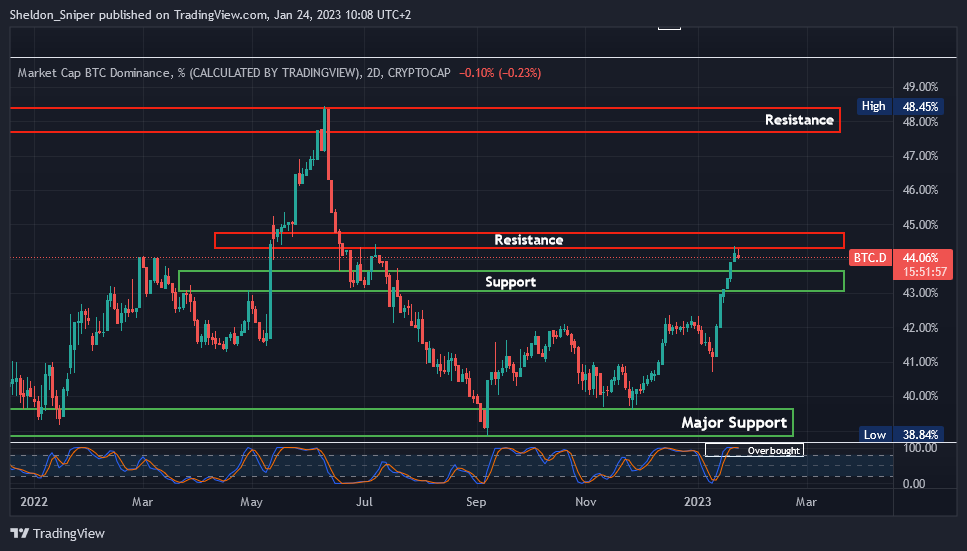
Chart #4 - Bitcoin Dominance (BTC.D) 2-Day Chart
Chartist: Sheldon
(For the chart screenshot, click here.)
Bitcoin Dominance has been increasing since September, moving from around 39% to just over 44%, and has affected the general altcoin market.
BTC.D is currently in an area of resistance and overbought (on the higher time frames). It could go sideways here or potentially retrace back down to the previous support at around 43.5% (which will allow some altcoins to catch up with BTC).
If the current resistance breaks and BTC.D moves higher, the next crucial resistance is up at 48%.
Check our Crypto Banter Discord here for updates!
Follow me on Twitter to get all the updates on my personal trading progress!
Claim your Bitget sign-up bonuses here (details below).
Winning Bitget UID: 1383252630
Chart #5 - Bitcoin Fear and Greed Index
The Bitcoin Fear and Greed Index is sitting at 52 today, Neutral.
The highest the index has been over the past seven days is 53, and the lowest is 45.

Overall Market Sentiment (Banter’s Take)
It's a critical week for markets and, as it stands, they appear to be shifting. But bidding higher lows is more important than getting trigger-happy near resistance.
A game of patience is required, which separates the good from the best.
Stay safe my friends!
Thanks for all your hard work, really appreciated it ; -))
Thanks for sharing :)