

📈📉 Will the sell-off continue? Bitcoin at critical support!
📈📉 Will the sell-off continue? Bitcoin at critical support!


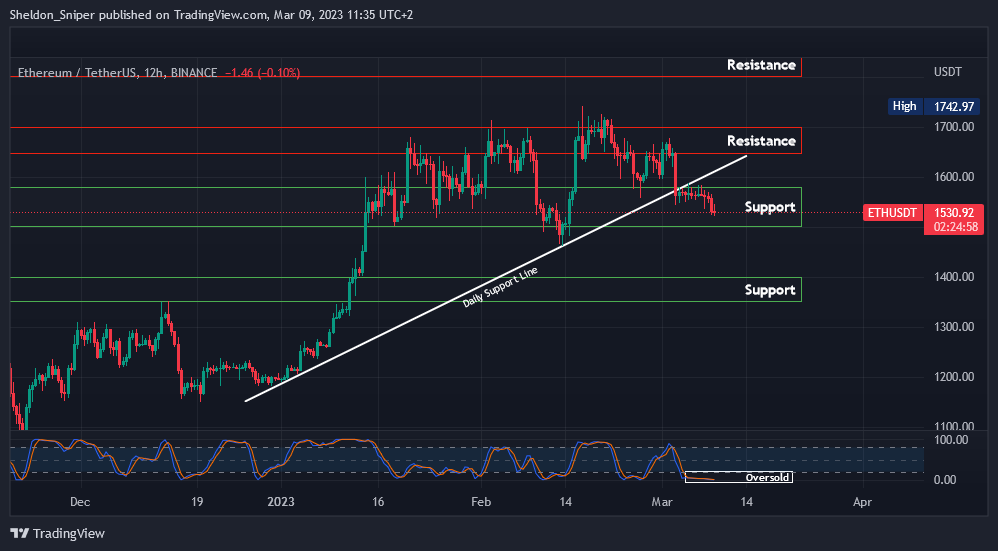
Chart #1 - Ethereum (ETHUSDT) 12-Hour Chart
Chartist: Sheldon
(For the chart screenshot, click here.)
ETH is holding up well despite the rest of the crypto market tumbling.
Currently at $1,530, ETH's high time frame indicators are oversold, indicating it could possibly bounce soon. A move higher from here could take the price to the previous daily support line at around $1,620. But major resistance sits at $1,650.
If ETH breaches $1,500, the next critical support level is $1,400.
Check our Crypto Banter Discord here for updates!
Follow me on Twitter for urgent updates on my trading progress!
𝗣𝗿𝗶𝗺𝗲 𝗫𝗕𝗧
Sign up for a new Trading Account on Prime XBT!
Receive a deposit bonus of up to $7,000 with promo code: SheldonSniper
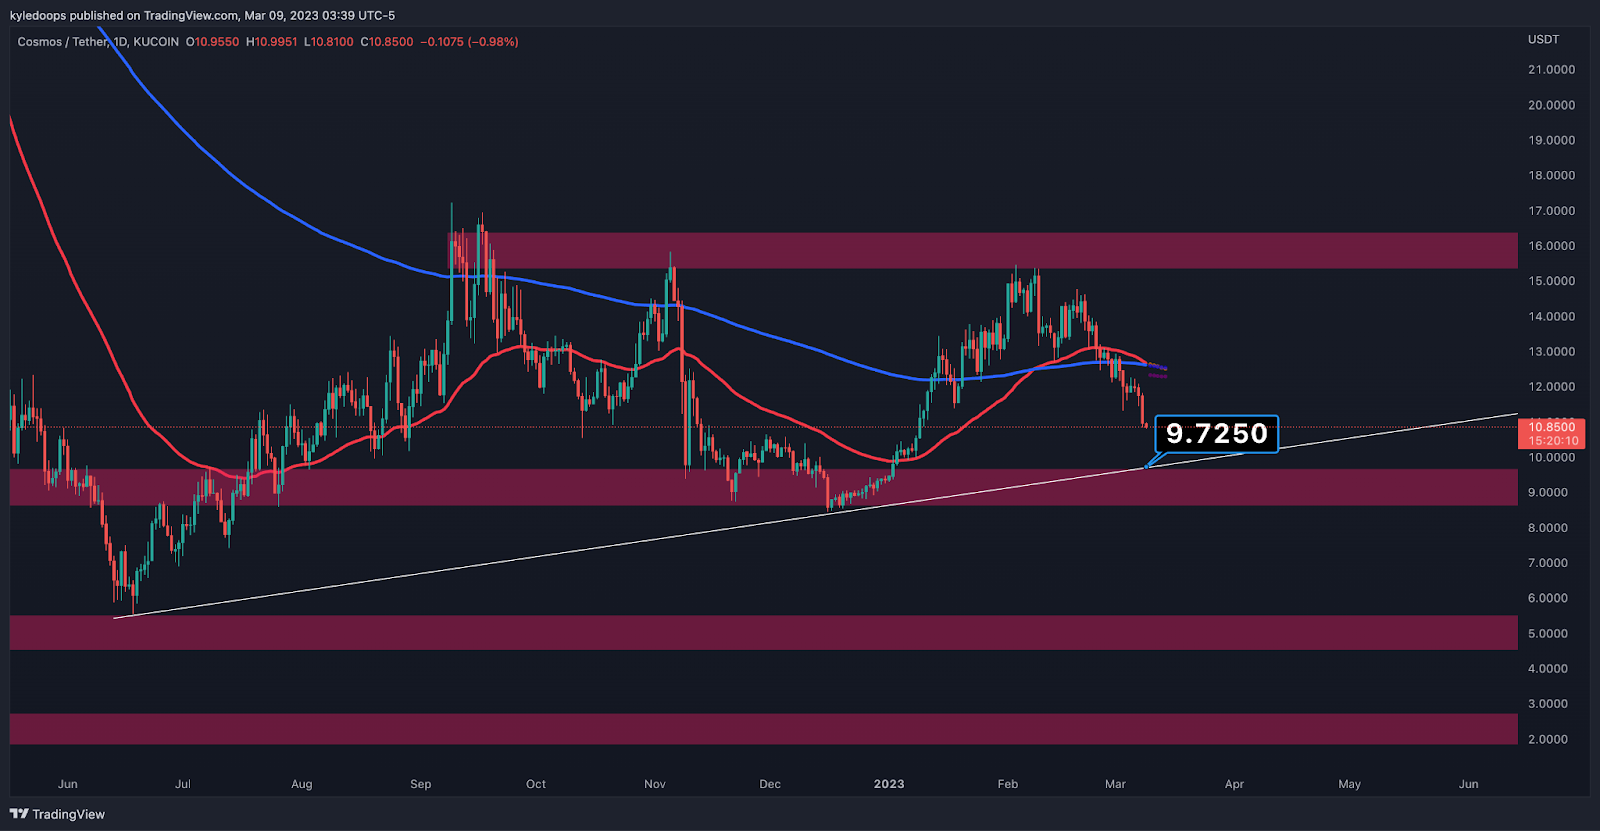
Chart #2 - Cosmos Hub (ATOMUSDT) 1-Day Chart
Chartist: Kyle
(For the chart screenshot, click here.)
ATOM is approaching a key level at $9.70.
Not only is that level diagonal support, but it's also horizontal support. That means, at the very least, a bounce should be in play.
Once the bounce occurs, we will re-evaluate the next major levels.
Check our Crypto Banter Discord here for updates!
Make sure to follow me on Twitter, where I will post updates on my trades as they unfold!
Claim your Bitget sign-up bonuses here (details below).

Sign up for a new Trading Account on Prime XBT!
Receive a deposit bonus of up to $7,000 with promo code: SheldonSniper
Chart #3 - Bitcoin (BTCUSD) 1-Day Chart
Chartist: Kyle

(For the chart screenshot, click here.)
This chart shows bitcoin with the "Coates moving averages" indicator overlayed and the "Fisher distance from EMA" oscillator at the bottom.
Any time the oscillator at the bottom of the screen gets into the -2.4 to -3.4 level, the probability of a bounce becomes higher. If bulls want to keep their hope alive, they must strike as soon as possible to keep the higher lows intact. If the bounce takes place, the next thing to do is to watch for a higher high or lower high.
A loss of the current support level would mean bitcoin could go down to $18,500.
Check our Crypto Banter Discord here for updates!
Make sure to follow me on Twitter, where I will post updates on my trades as they unfold!
Claim your Bitget sign-up bonuses here (details below).
Bitget winner - 8599936260
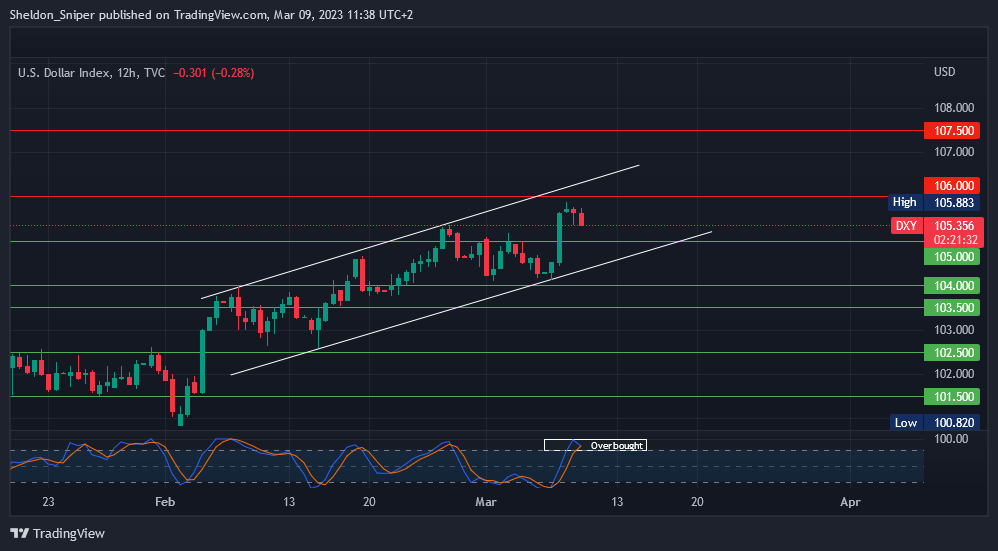
Chart #4 - DXY 12-Hour Chart
Chartist: Sheldon
(For the chart screenshot, click here.)
The DXY is overbought on the medium time frames and finds itself in an area of resistance. If rejected here, it could visit support between 104.50 - 105.00.
It's worth noting that the DXY is also in a rising channel structure, which has a 68% chance of a break to the downside occuring.
Check our Crypto Banter Discord here for updates!
Follow me on Twitter to get all the updates on my personal trading progress!
𝗣𝗿𝗶𝗺𝗲 𝗫𝗕𝗧
Sign up for a new Trading Account on Prime XBT!
Receive a deposit bonus of up to $7,000 with promo code: SheldonSniper
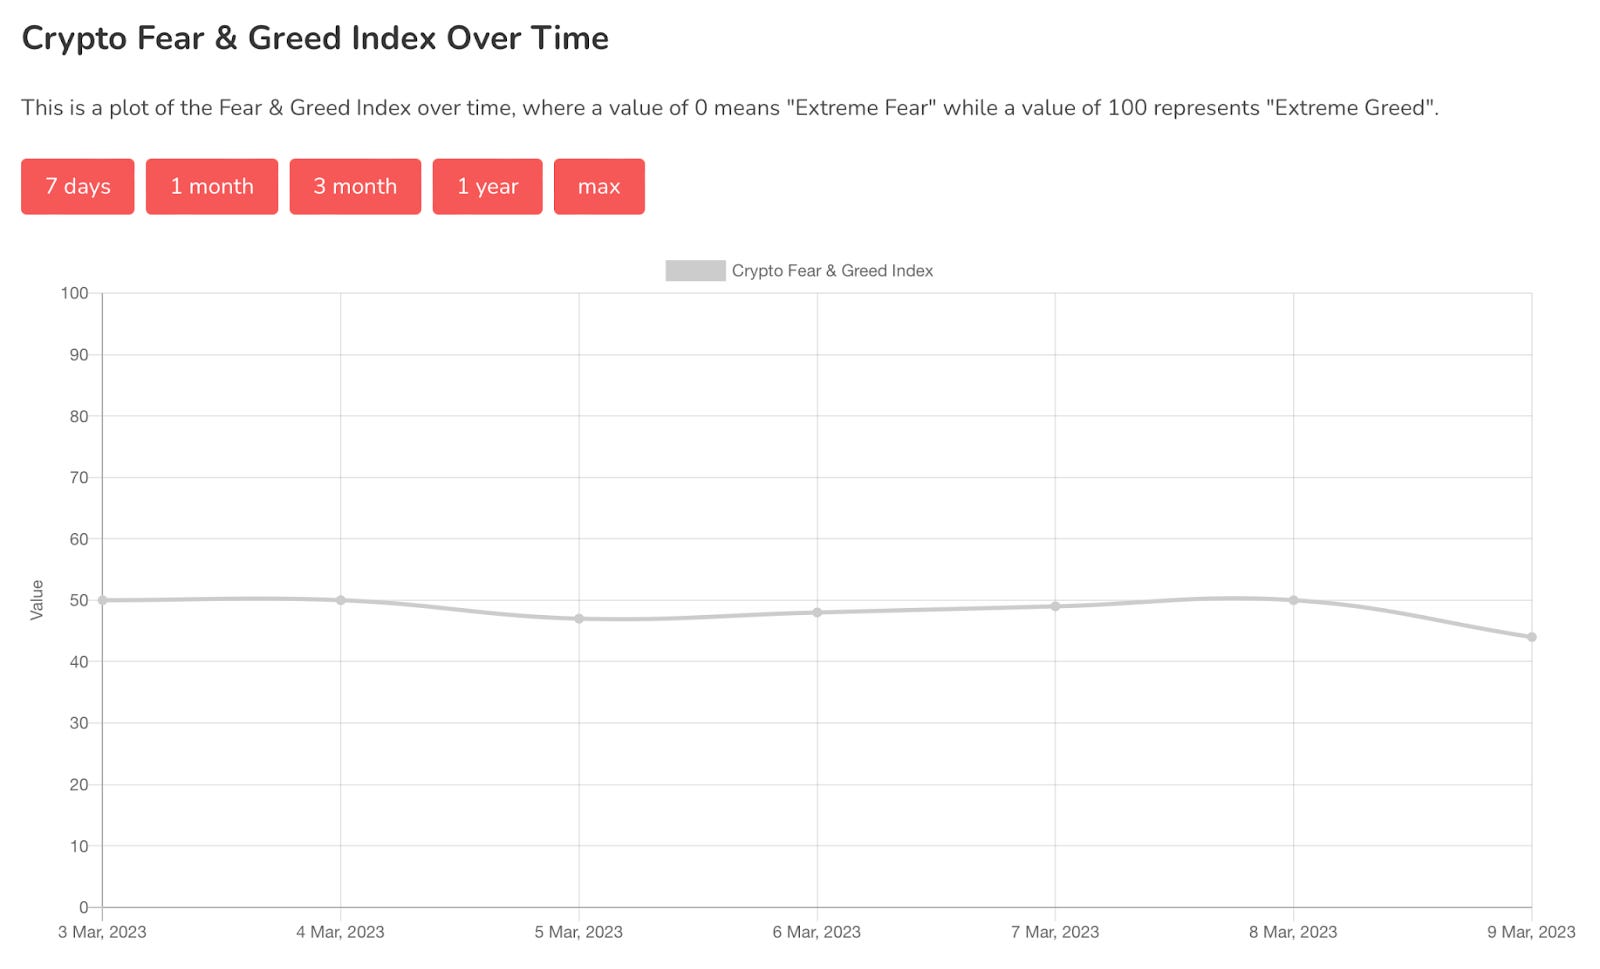
Chart #5 - Bitcoin Fear and Greed Index
The Bitcoin Fear and Greed Index is sitting at 44 today, indicating Fear.
The highest the index has been over the past seven days is 50, and the lowest is 44.
Overall Market Sentiment (Banter’s Take)
The market sell-off is likely to continue today. After that, a relief bounce should be expected. Bitcoin is at a critical support level now. Losing it would mean another 10% down for BTC.
Stay safe my friends!
Bybit winner - 29023629