

📈📉 XRP Long Entry + The Case for $32k BTC!
📈📉 XRP Long Entry + The Case for $32k BTC!

Overview
Chart #1 - XRP (XRPUSDT) 12-Hour Chart
Chart #2 - S&P 500 Weekly Chart
Chart #3 - Bitcoin (BTCUSD) Hourly Chart
Chart #4 - Avalanche (AVAXUSDT) Daily Chart
Chart #5 - Fear and Greed Index

Chart #1 - XRP (XRPUSDT) 12-Hour Chart
Chartist: Sheldon
(For the chart screenshot, click here.)
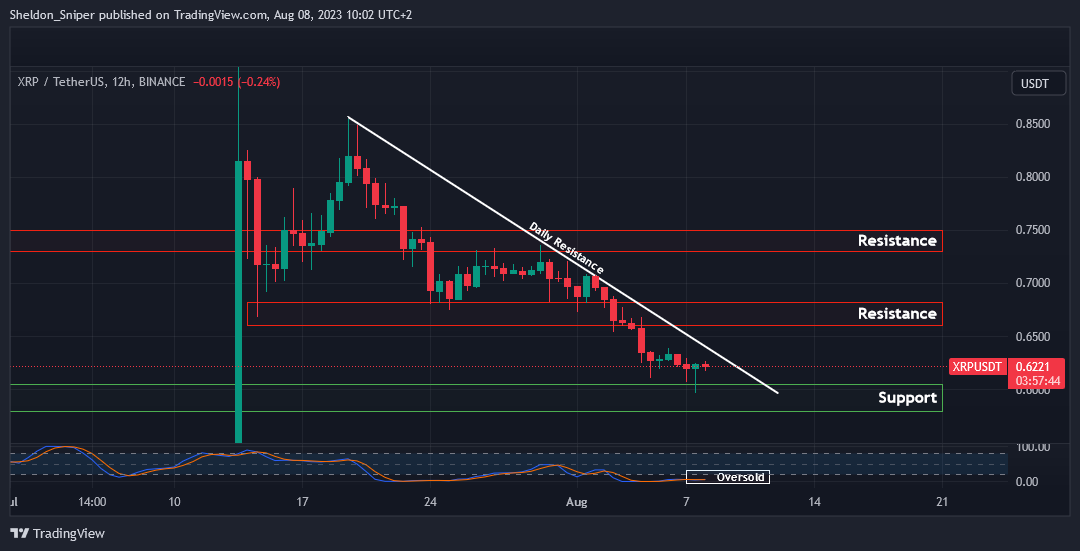
XRP appears to be oversold on higher time frames, having retraced down to the $0.58 - $0.60 support area.
This could be a zone to enter a long trade, as long as the area maintains its supportive role.
The next hurdle is the descending daily resistance line that originates from mid-July, around $0.64, with the subsequent significant resistance positioned at $0.66 - $0.68.
Sign-up and trade on Bybit today.
Exclusive $30,000 deposit rewards and bonuses up for grabs!
Chart #2 - S&P 500 Weekly Chart
Chartist: Kyle
(For the chart screenshot, click here.)
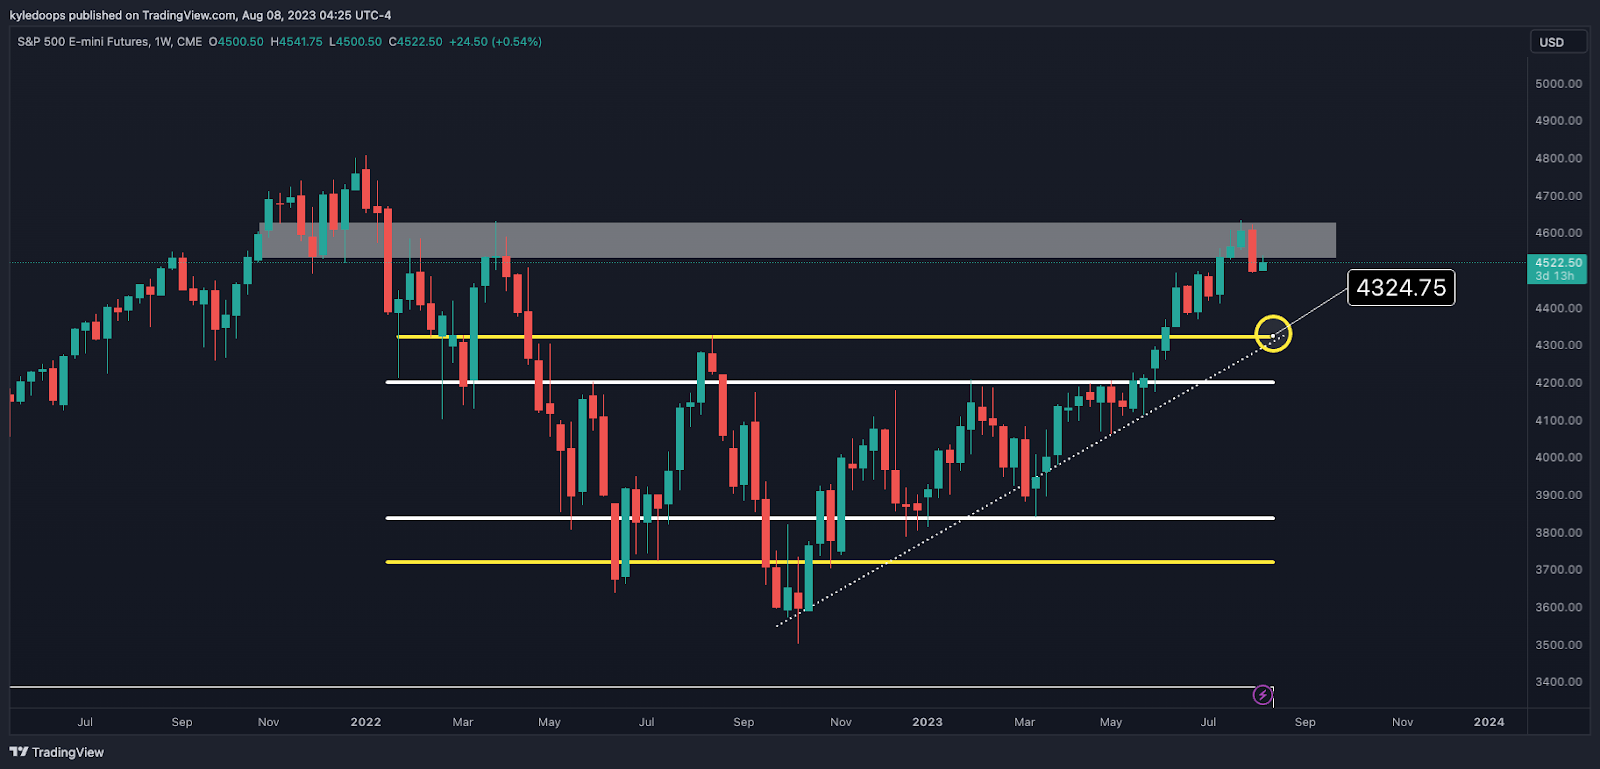
The S&P 500 has rejected from the major upside resistance.
This is likely a shallow pullback, which could later lead to a bigger push upwards, clearing the all-time highs.
The pullback should find some support at 4,324.75. If the price bounces from there, it is likely to represent the next major higher low, leading to a continuation higher.
𝗣𝗿𝗶𝗺𝗲 𝗫𝗕𝗧
Sign up for a new Trading Account on Prime XBT!
Receive a deposit bonus of up to $7,000 with promo code: KyleDoops

Sign up for a new Trading Account on Prime XBT!
Receive a deposit bonus of up to $7,000 with promo code: SheldonSniper
Chart #3 - Bitcoin (BTCUSD) Hourly Chart
Chartist: Kyle
(For the chart screenshot, click here.)
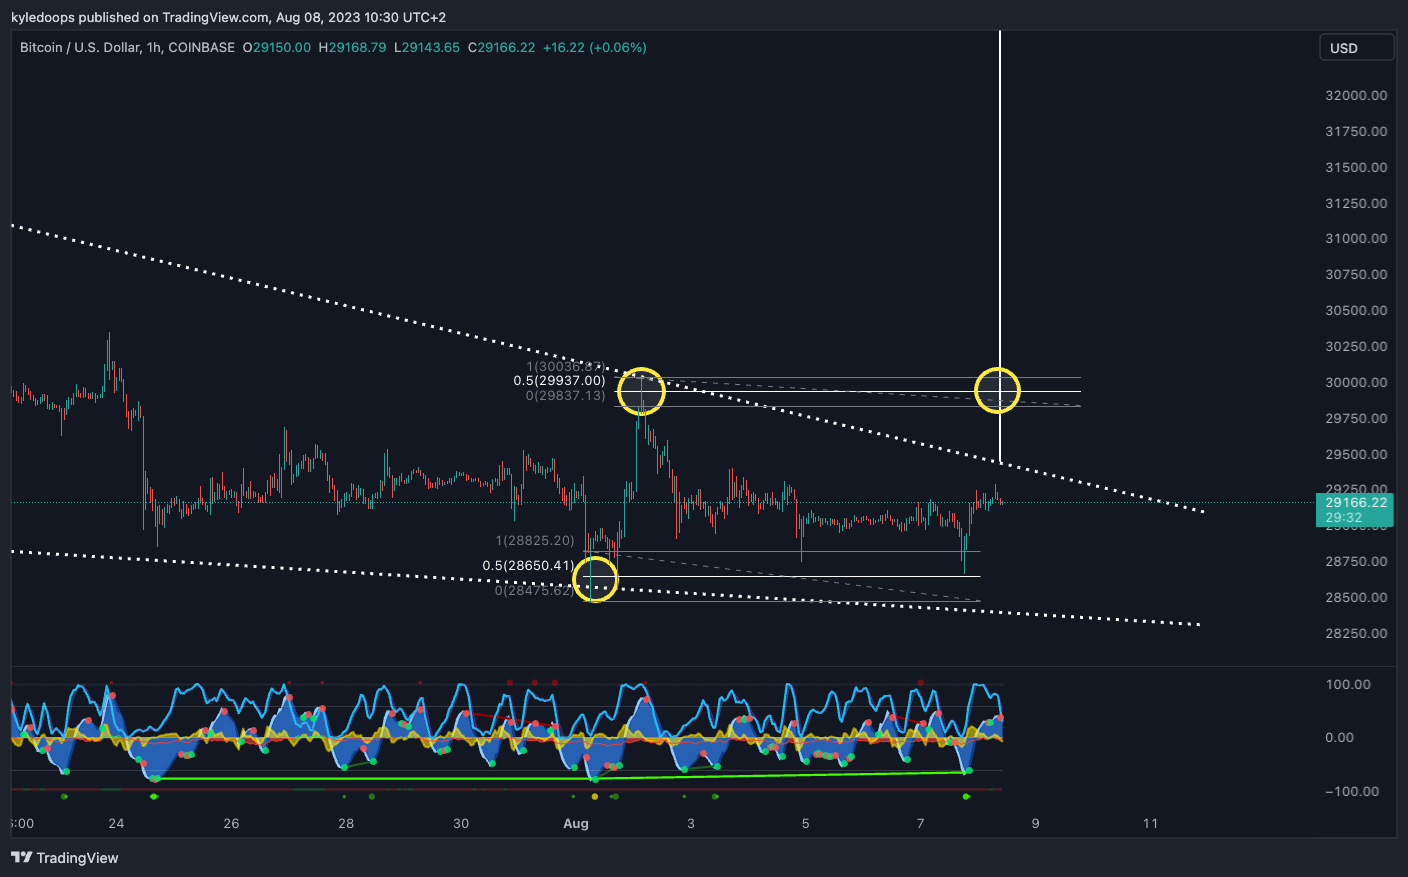
Bitcoin tapped into the lower-side liquidity at $28,650.41, and I would now be targeting the upside liquidity at $29,937.
The intriguing aspect is that once the upside liquidity is taken, if the price continues to hold above that level, it is likely to pivot higher timeframe charts towards the upside. This shift would create higher lows and break the price out of the falling wedge, which is a bullish pattern.
The measured move from the falling wedge could push the price to the range highs at $32,645.49.
Claim your Bitget sign-up bonuses here (details below).
Chart #4 - Avalanche (AVAXUSDT) Daily Chart
Chartist: Sheldon
(For the chart screenshot, click here.)
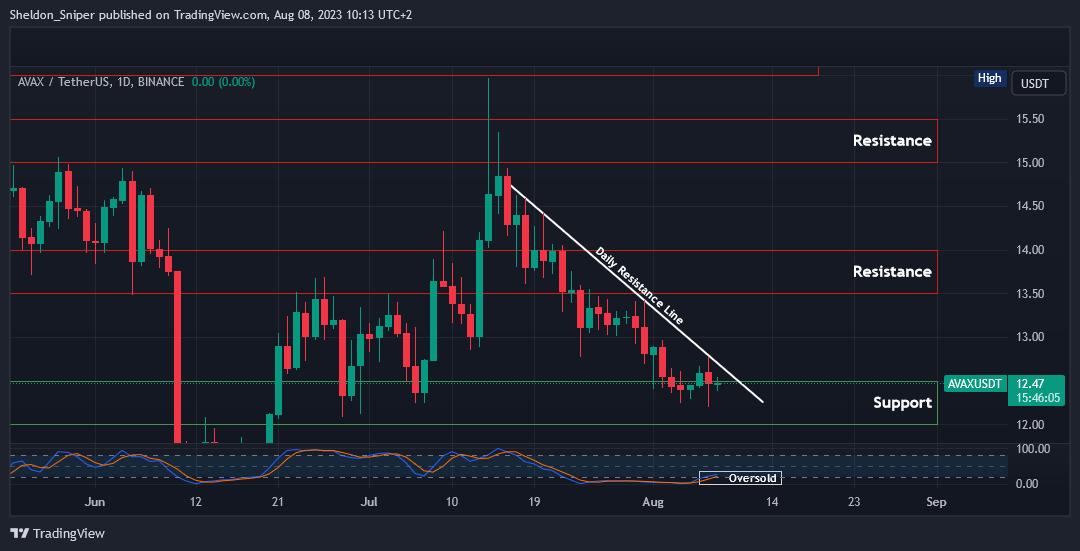
Over the past three weeks, AVAX has retraced from $17.00 down to the current $12.00 - $12.50 support area, where the price has held steady for the last five days.
The price is oversold on higher time frames, and if the current support holds, there's a potential for a higher move to test the next resistance. This is the daily descending resistance line at around $12.75 - $13.00. If that line is breached, the next resistance area is at $13.50 - $14.00.
AVAX is a robust Layer-1 altcoin, and as the general market begins to swing back to the upside, the price of AVAX should respond positively from its current support position.
Claim your Bitget sign-up bonuses here (details below).
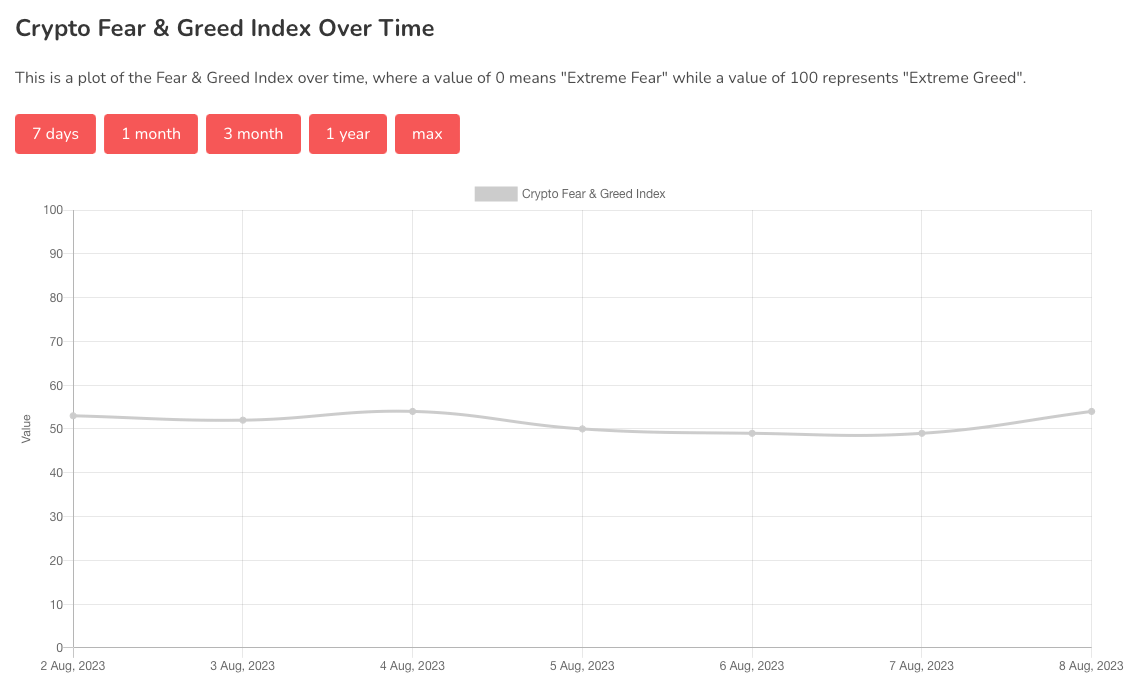
Chart #5 - Fear and Greed Index
The Fear and Greed Index is sitting at 54 today, Neutral.
The highest the index has been over the past seven days is 54, and the lowest is 49.
Banter’s Take
The market is still awaiting a substantial volatility expansion, with bears running out of time to effectively drive the price down. If they don't act within the next 48 hours, it's likely that bulls will regain control.
Stay safe my friends!
Go to our Crypto Banter Discord here where Sheldon and Kyle give updates on the charts and trades from The Daily Candle newsletter!