

📈📉 You DON'T Want To MISS This DOT Trade!
📈📉 You DON'T Want To MISS This DOT Trade!
PLUS: AGIX About To BREAK ATH?
Overview
Chart #1 - Crypto Total Market Cap (TOTAL) Weekly
Chart #2 - Worldcoin (WLDUSDT) 8-Hour
Chart #3 - SingularityNET (AGIXUSDT) 8-Hour
Chart #4 - Polkadot (DOT) 8-Hour
Chart #5 - Fear and Greed Index
Chart #1 - Crypto Total Market Cap (TOTAL) Weekly
Chartist: Sheldon
(For the chart screenshot, click here.)
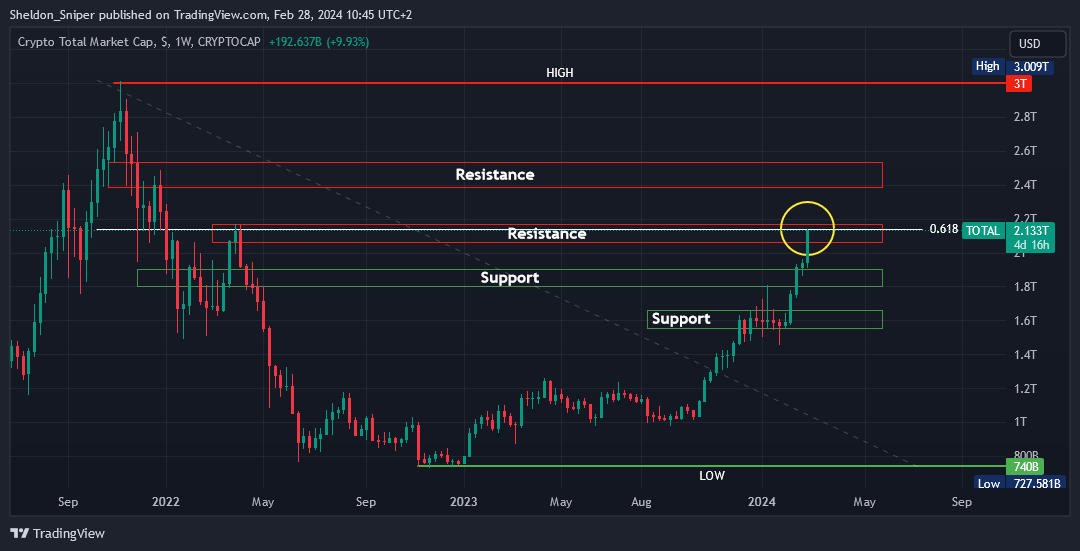
We need to be aware of the current risk in the market!
Both BTC and the TOTAL are at major resistance. The TOTAL is also at the crucial 0.618 Fibonacci level, and adds to the risk here.
We may have to wait and see how the market plays out before going long on any trades. I would rather wait for the TOTAL to break and retest this upper level of resistance of $2.15T - $2.2T.
If it does breach $2.2T, the next resistance is at $2.4T - $2.55T, which is around 15% higher than where we are now. If the market retraces, the next area of support is at $1.8T - $1.9T.
A correction will be healthy, and set the market up for the next leg up.
Sign-up and trade on Bybit today.
Exclusive $30,000 deposit rewards and bonuses up for grabs!
Chart #2 - Worldcoin (WLDUSDT) 8-Hour
Chartist: Kyle
(For the chart screenshot, click here.)
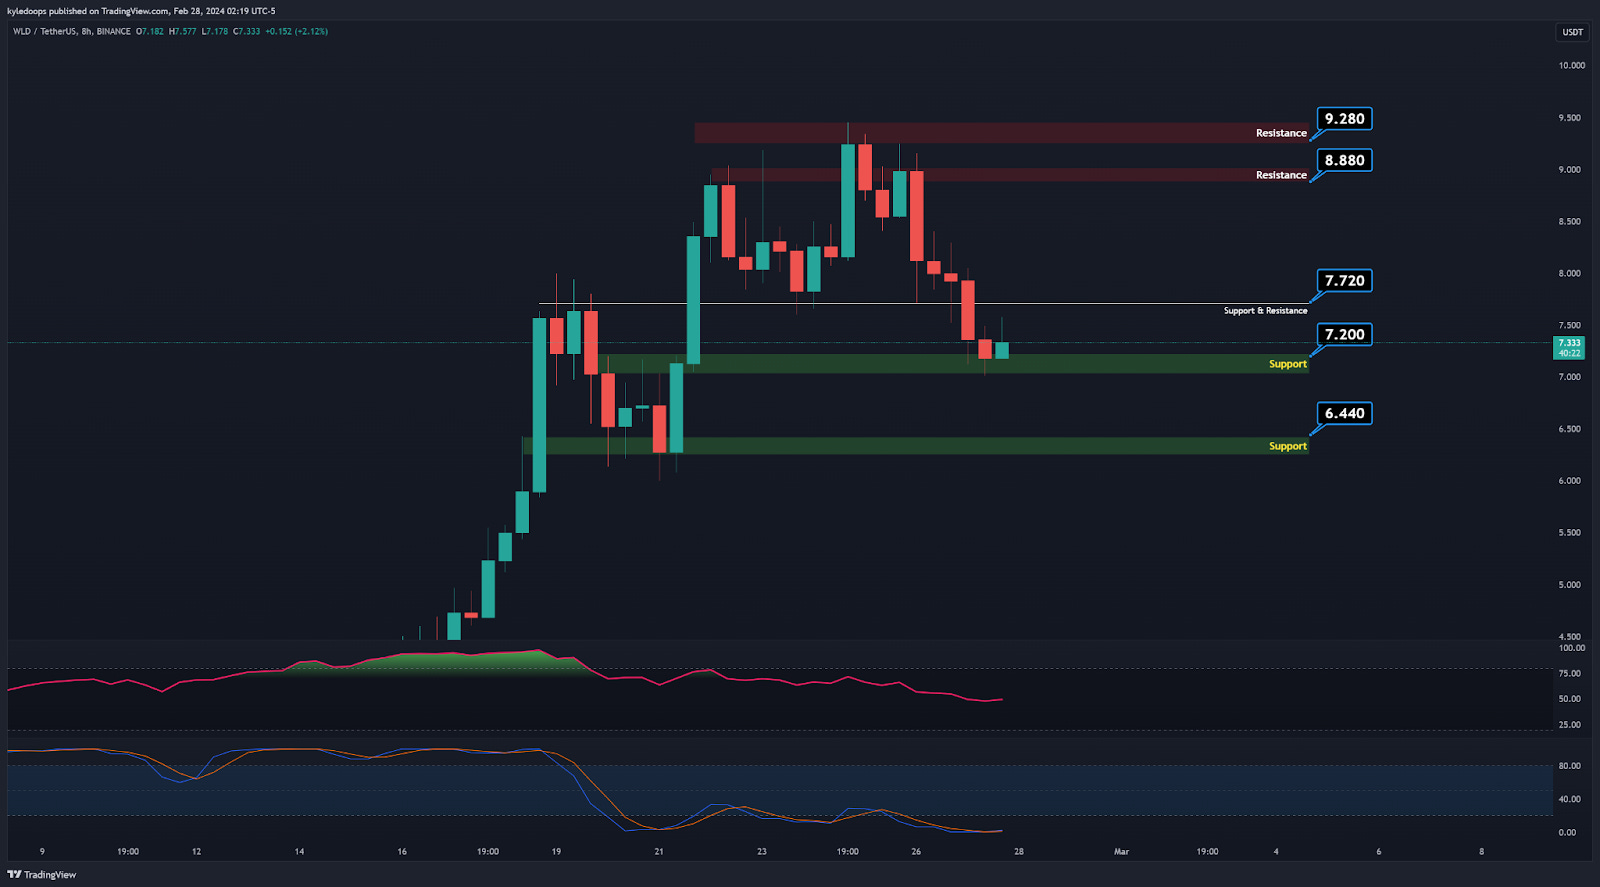
WLD is at support and has not moved much after Bitcoin's pump.
The Stochastic RSI on the 8-hour chart shows the beginning of a reversal, so there’s a high possibility of an upward move. For this upward trend to play out, it must claim the $7.720 level and aim for resistance at $8.880, followed closely by another resistance at $9.280.
In the unlikely event of a further decline, the next level of support is at $6.440.
Claim your Bitget sign-up bonuses here (details below).

Outsmart 99% Of The Market!
Get full access into our Discord And Telegram group, where you'll find all of our premium content!
👉 Trade Signals!
👉 Trade Set-Ups!
👉 Trading Challenges!
👉 Education!
👉 SO MUCH MORE!
Chart #3 - SingularityNET (AGIXUSDT) 8-Hour
Chartist: Kyle
(For the chart screenshot, click here.)
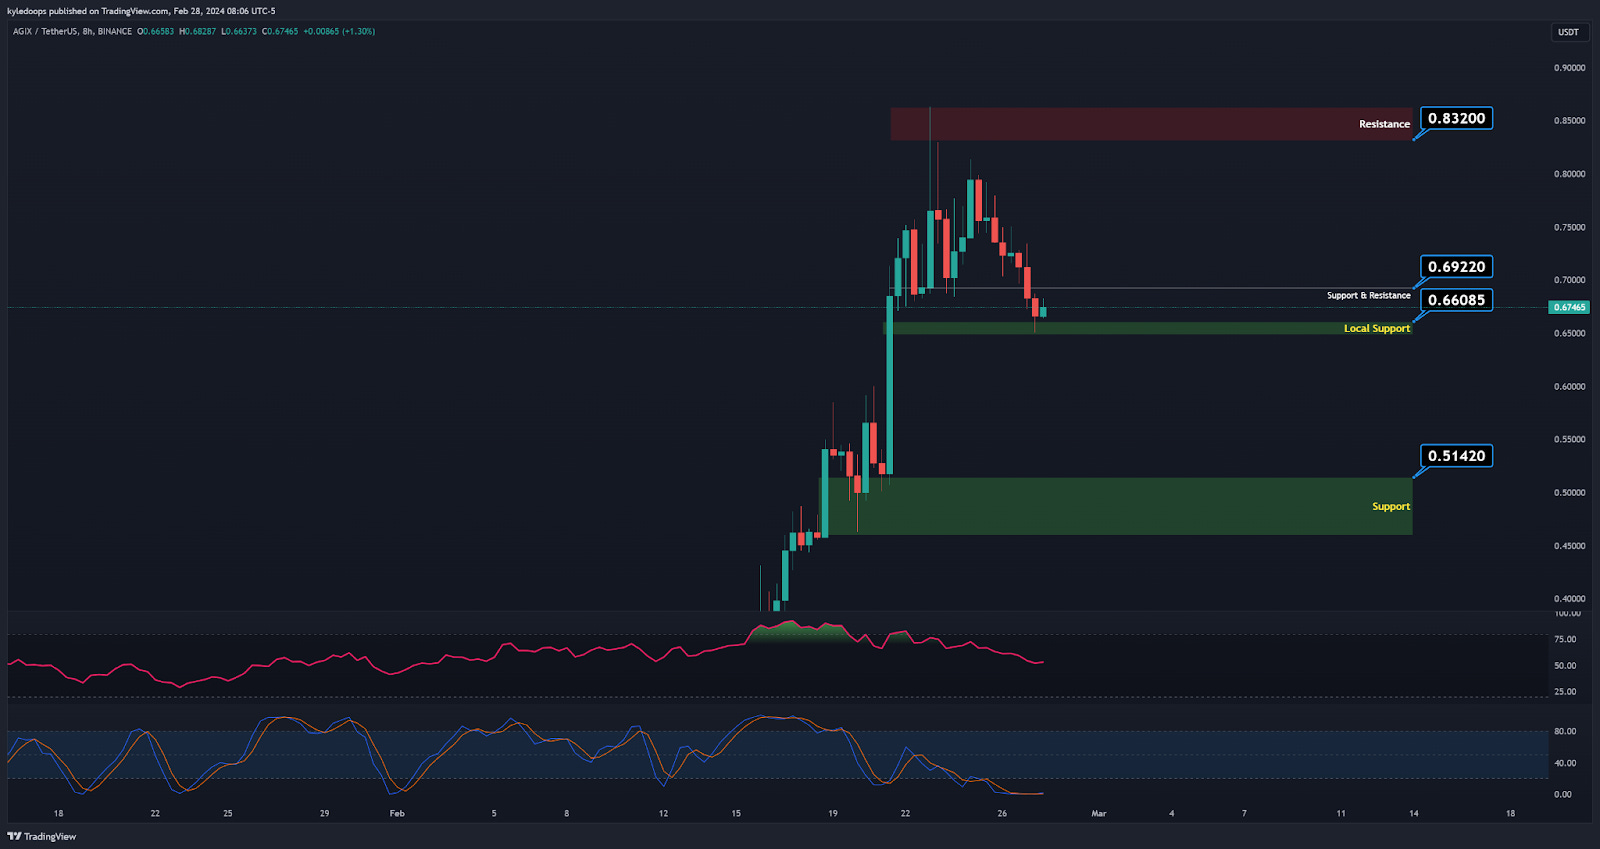
AGIX has retraced nearly 25% from its recent high, and it may have found local support for a bounce at $0.66.
The Stochastic RSI is showing a bullish crossover at these levels, but it still needs to surpass the $0.69 level to aim for the next resistance at $0.83 and potentially break its all-time high (ATH) again.
If it fails to hold and validate $0.66 as support, it could head to major support at $0.51.
Claim your Bitget sign-up bonuses here (details below).
Chart #4 - Polkadot (DOT) 8-Hour
Chartist: Sheldon
(For the chart screenshot, click here.)
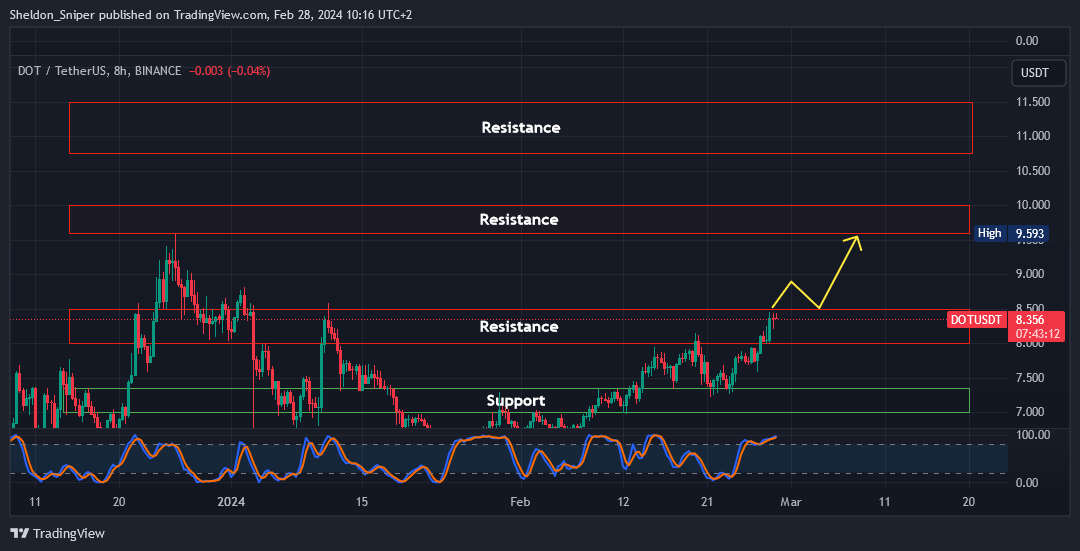
I mentioned the current risk in the market.
But there is a long trade play on DOT. My strategy would be for price to first break and retest the $8.50 level before entering into it.
Entry: Wait for a break and retest of the $8.50 level, with an open and close of a 4HR candle above that level.
Take Profit (TP):
TP1: $9.60 - $10.00 (13% - 17%)
TP2: $10.75 - $11.50 (26% - 35%)
Stop Loss: Just below $8.00
Claim your Bitget sign-up bonuses here (details below).
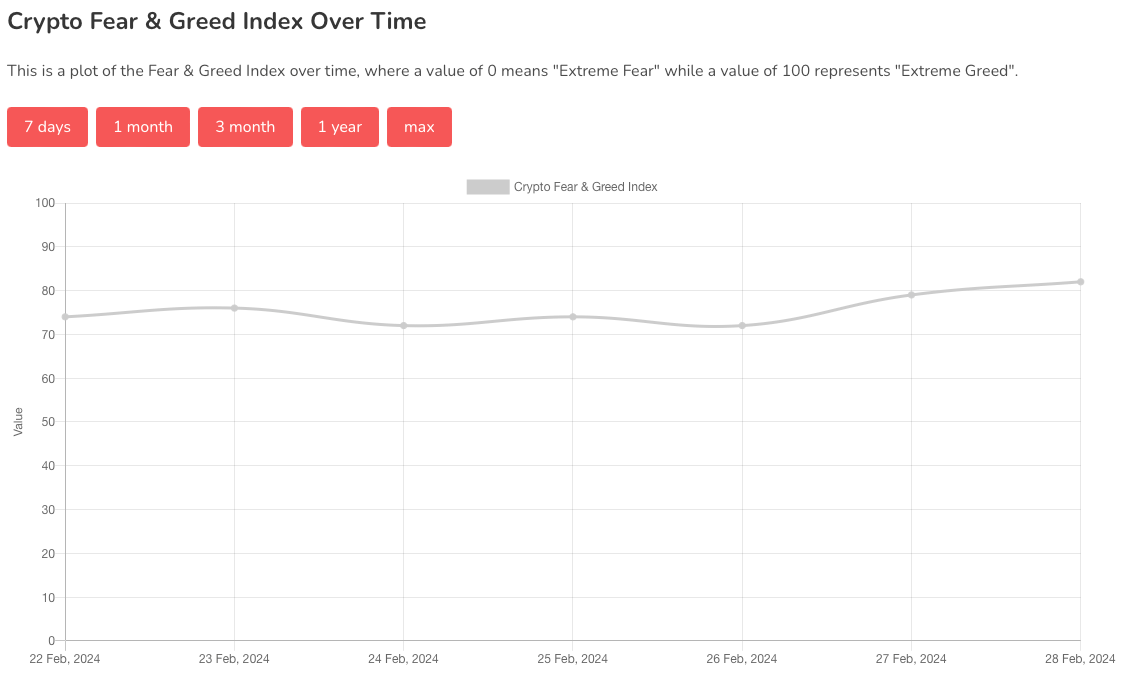
Chart #5 - Fear and Greed Index
The Fear and Greed Index is sitting at 82 today, indicating Extreme Greed.
The highest the index has been over the past seven days is 82, and the lowest is 72.
Banter’s Take
Bitcoin appears to be unstoppable, as are Bitcoin Dominance and the Total Market Cap. Moving forward, it seems that Bitcoin could be entering a parabolic stage. To confirm this, we need to watch the monthly close in a couple of days.
Stay safe my friends!
Go to our Crypto Banter Discord here where Sheldon and Kyle give updates on the charts and trades from The Daily Candle newsletter!