


📈📉 I'm Shorting Nvidia (NVDA)? Why? Check it out!
👉 PLUS: 5 Altcoin trade ideas for short and long term gains!
Hey everyone!
Markets are jittery, narratives are shifting, and opportunities are popping up for those who stay sharp. Today’s Daily Candle cuts through the noise with setups across crypto and stocks — from potential reversals to major rejection zones. If you're trading this week, this one's essential.
Let’s dive in!
Overview
Chart 1 - BTC/USDT Weekly
Chart 2 - AVAX/USDT 4hr LONG TRADE
Chart 3 - AAVE/USDT 8hr LONG TRADE
Chart 4 - DOT/USDT 4h (SPOT TRADE)
Chart 5 - AIXBT/USDT 8Hr LONG TRADE
Chart 6 - ICP/USDT 2Hr LONG TRADE
Chart 7 - NVDA 1W SHORT TRADE
Chart #1 - BTC Weekly
Chartist: Dylan

(For the chart screenshot, click here.)
BTC Weekly - BTC on the weekly has printed a few lower highs and the oscillator is still showing signs of weakness on this timeframe. When the market is super bearish or volatile I like to zoom out and focus on the big areas for context and you can see that the main supports to pay attention to currently are the 100/102k region and the 98/95k region.
If you would like to find out more about using the Oscillator, join Chart Hackers and register for the Xcelerator course!👇
Chart 2 - AVAX/USDT 4hr LONG TRADE
Chartist: Dylan

(For the chart screenshot, click here.)
AVAX LONG IDEA 4hr - AVAX has shown weakness relative to some other ALTS but could be nearing its reversal point. We can see the oscillator on various higher timeframes getting into reversal zones as well 4/8/12hr. There are two main areas for me in terms of longs, both should give some form of bounce or reaction, but its difficult to call how high in the current macro situation as news events can shift the market in both directions pretty quickly.
Entry 1: 17.35 to 16.8
TP: 18.3, 19.2, 20.6
Stop Loss: Close below 16.7
Entry 2: 15.35 to 14.7
TP: 15.6, 15.9, 16.7
Stop Loss: Close below 14.6
If you would like to find out more about using the Oscillator, join Chart Hackers and register for the Xcelerator course!👇
Chart 3 - AAVE/USDT 8hr LONG TRADE
Chartist: Dylan’s Chart Hackers Team

(For the chart screenshot, click here.)
AAVE 8hr LONG IDEA
AAVE has bled out with the market and is finally getting to the next strong reversal zone that I like, the Oscillators are nearly reset as well which tells us we could see one more dip before the real move up and this should dish out some entries for us.
ENTRY: 248 to 240
TP: 260, 272, 290
Stop Loss: Close below 239
If you would like to find out more about using the Oscillator, join Chart Hackers and register for the Xcelerator course!👇
Good Morning Crypto
Need a Daily Crypto Newsletter to keep you in touch with the latest news, market shifts and project developements?
Dive into today's issue of Good Morning Crypto! 👇

Chart 4 - DOT/USDT 4h (SPOT TRADE)
Chartist: Dylan’s Chart Hackers Team

(For the chart screenshot, click here.)
DOT/USDT – 4h Timeframe
A tough time in the market, war, FOMC, stagflation brings uncertainty. Trying to catch a falling knife can slice your hands off so important to check low leverage or SPOT trades. As much as a 5-6% downside, I’m opening spot trades here only.
Remember, you worked hard for your money, work harder to keep it.
SPOT TRADE IDEA
Entry: 3.51 region
SL : 3.24 region (candle close below)
TP1 : 3.93 region
TP2 : 4.25 region
1) Oscillator shows bullish divergence which hasn’t yet played out, as well as this the RSI is super low, turned up and has reversal signs present.
2) Candles are still red, we are looking for a flip from red to green now we are down in the support region, watching specifically for larger wicks to the downside.
3) The discount zone we currently find ourselves is present across multiple timeframes and we would look for this to help give confluence to the bounce area.
4) Most of the order blocks and liquidity is to the upside, as it the pulled vwap, the 100 day MA, the quantum reactor and the money flow POC.
5) In summary, absolutely everything is leading to a bounce, however we are mindful of the news this week and the world affairs and if we have learnt anything is that the market is not logically doing what we expect often, make sure you are using stop losses, always.
If you would like to find out more about using the Oscillator, join Chart Hackers and register for the Xcelerator course!👇
Chart 5 - AIXBT/USDT 8Hr LONG TRADE
Chartist: Dylan’s Chart Hackers Team
(For the chart screenshot, click here.)
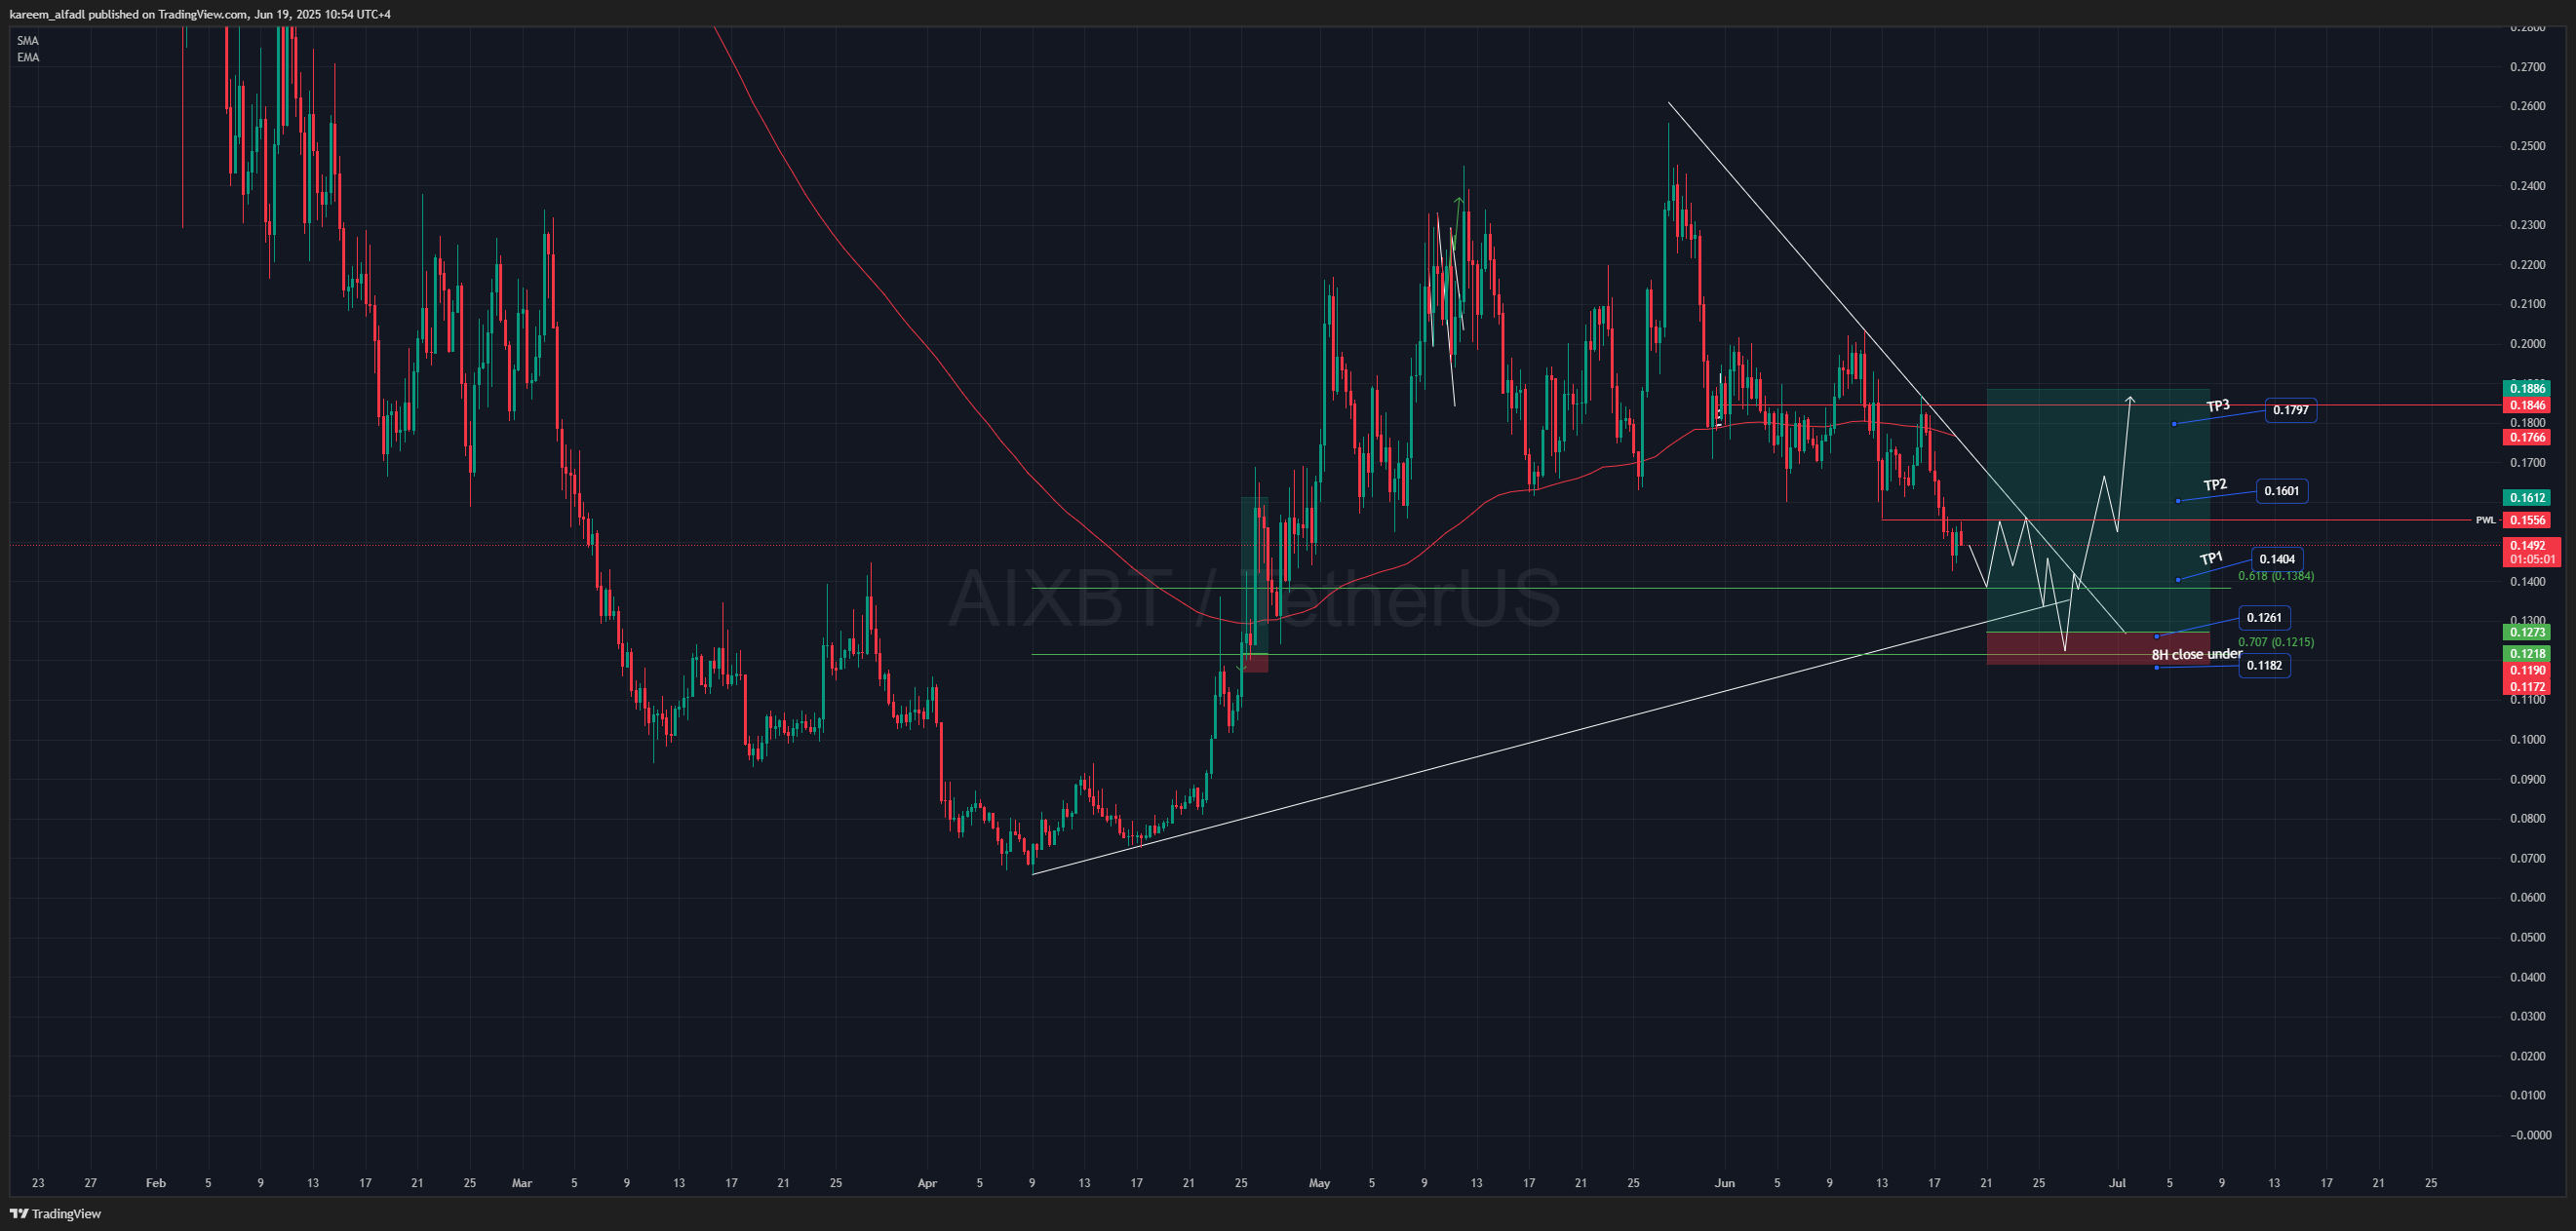
AIXBT - 8H
AIXBT currently consolidating under previous week's lows and showing signs of further retracement. If market continues to show weakness it would make sense for AIXBT to pull further back to test the macro rising trend and major .618 and .707 fib level and expecting major demand to come in at the 0.1240$ mark.
Trade - ladder in approach - 5x
Entry: $0.126 - $0.1185 (ladder approach 20/20/60)
TP1: $0.1404
TP2: $0.1601
TP3: $0.1797
Stop Loss: 8H close under $0.1182
If you would like to find out more about using the Oscillator, join Chart Hackers and register for the Xcelerator course!👇
Chart 6 - ICP/USDT 2Hr LONG TRADE
Chartist: Dylan’s Chart Hackers Team

(For the chart screenshot, click here.)
ICP/USDT – 2H Time Frame
ICP is retracing after rejecting just above the previous month high (PMH) at $6.122. Price is approaching a high-probability demand zone between $4.75 and $4.46, which aligns with the VAL, previous structural support, and the 0.618–0.707 Fib retracement range. The plan is to layer into the position across this zone, starting light and increasing size toward the bottom. The macro structure remains bullish unless we break below $4.45. If buyers step in, we expect a move back toward $5.32 (mid-range resistance) and possibly an extension to $5.85 (0.707 Fib), with $6.12 still acting as major resistance overhead.
Levels
Entry: $4.75 → $4.46 (layered entries: 20/40/40)
TP1: $5.325
TP2: $5.852
Stop Loss: $4.45 (below structure + invalidation)
If you would like to find out more about using the Oscillator, join Chart Hackers and register for the Xcelerator course!👇
Chart #7 - NVDA Daily Short
Chartist: Dylan

(For the chart screenshot, click here.)
NVDA Daily Short IDEA - NVDA could be teeing up for short round number 2 while it pumps into the ATH region. We know a few of the major shareholders have sold substantial amounts as well, nothing wrong with taking some profits but just interesting timing. Oscillator shows bearish divergence and we are approaching the ATH zone and OB which could offer a rejection on the next pump into this area.
ENTRY: 150 to 154
TP: 138, 129
Stop Loss: Close above 155
If you would like to find out more about using the Oscillator, join Chart Hackers and register for the Xcelerator course!👇
That’s a wrap for today’s setups.
Whether you’re spotting divergence, scaling into key zones, or just observing from the sidelines — protect your capital, trade with intention, and keep the oscillator close. More alpha coming your way tomorrow.
Until then, stay tactical.
— The Chart Hackers Team 🔍📈