

📈📉 Is the stock market about to take bitcoin down with it? THETA gains incoming?
📈📉 Is the stock market about to take bitcoin down with it? THETA gains incoming?

Bitget winner - 6112662033
Sniper School
Sniper School kicks off a new cohort next week on Monday! What is Sniper School? Free 3-week trading course with Sheldon. You will learn how to trade like a pro in 3 short weeks and capitalize on the change in the markets.
There are only 3k seats and the waitlist is filling up fast! We still have some spots left for those that complete the entrance requirements of signing up for a fee exchange account and funding it. You’ll use it to trade live during the course.
The course includes weekly live workshops hosted by Sheldon, Mama Sniper, and special guests, plus daily live trading and market analysis sessions with our team of Sniper Mentors!
It’s not just a school. It really is the start of an incredible journey with our family of degens! Reserve your spot now by clicking here.
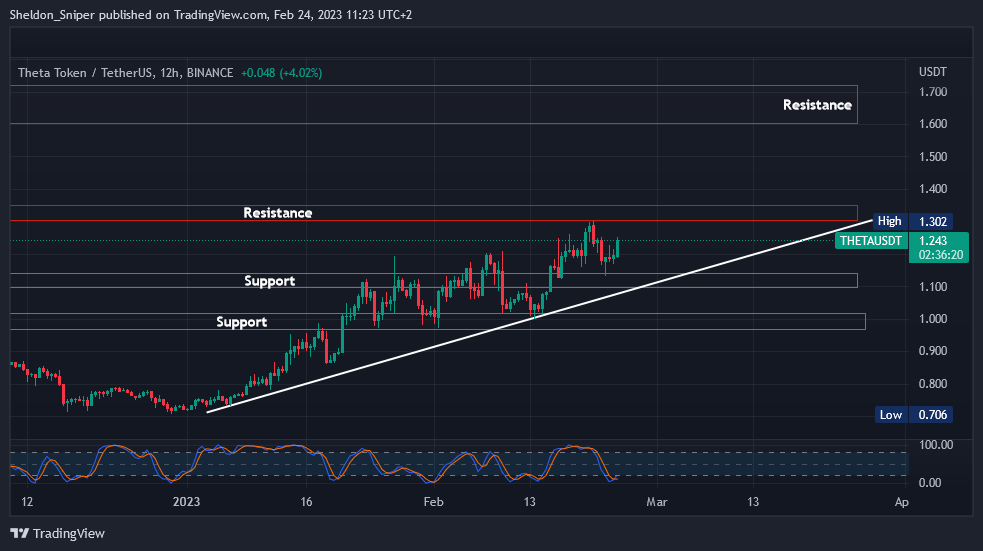
Chart #1 - Theta Network (THETAUSDT) 12-Hour Chart
Chartist: Sheldon
(For the chart screenshot, click here.)
THETA has been lagging compared to some other alts, but over the past few days, it has been getting ready to test its next levels of overhead resistance.
THETA started the year at $0.70, rallied to $1.30, retraced back down to support at $1.10, and finally moved back up to $1.25. Now, if THETA can break above $1.30 (resistance), it could test $1.60 - $1.70. But that is highly dependent on how bitcoin and the stock market are performing.
THETA's next significant lower support sits at $1.10, followed by the $1.00 level.
Overall, it looks like THETA may have ended its massive downtrend - that began in May 2021 - in December. If so, THETA could be in for some nice gains over the next few months.
Check our Crypto Banter Discord here for updates!
Follow me on Twitter for urgent updates on my trading progress!
Claim your Bitget sign-up bonuses here (details below).
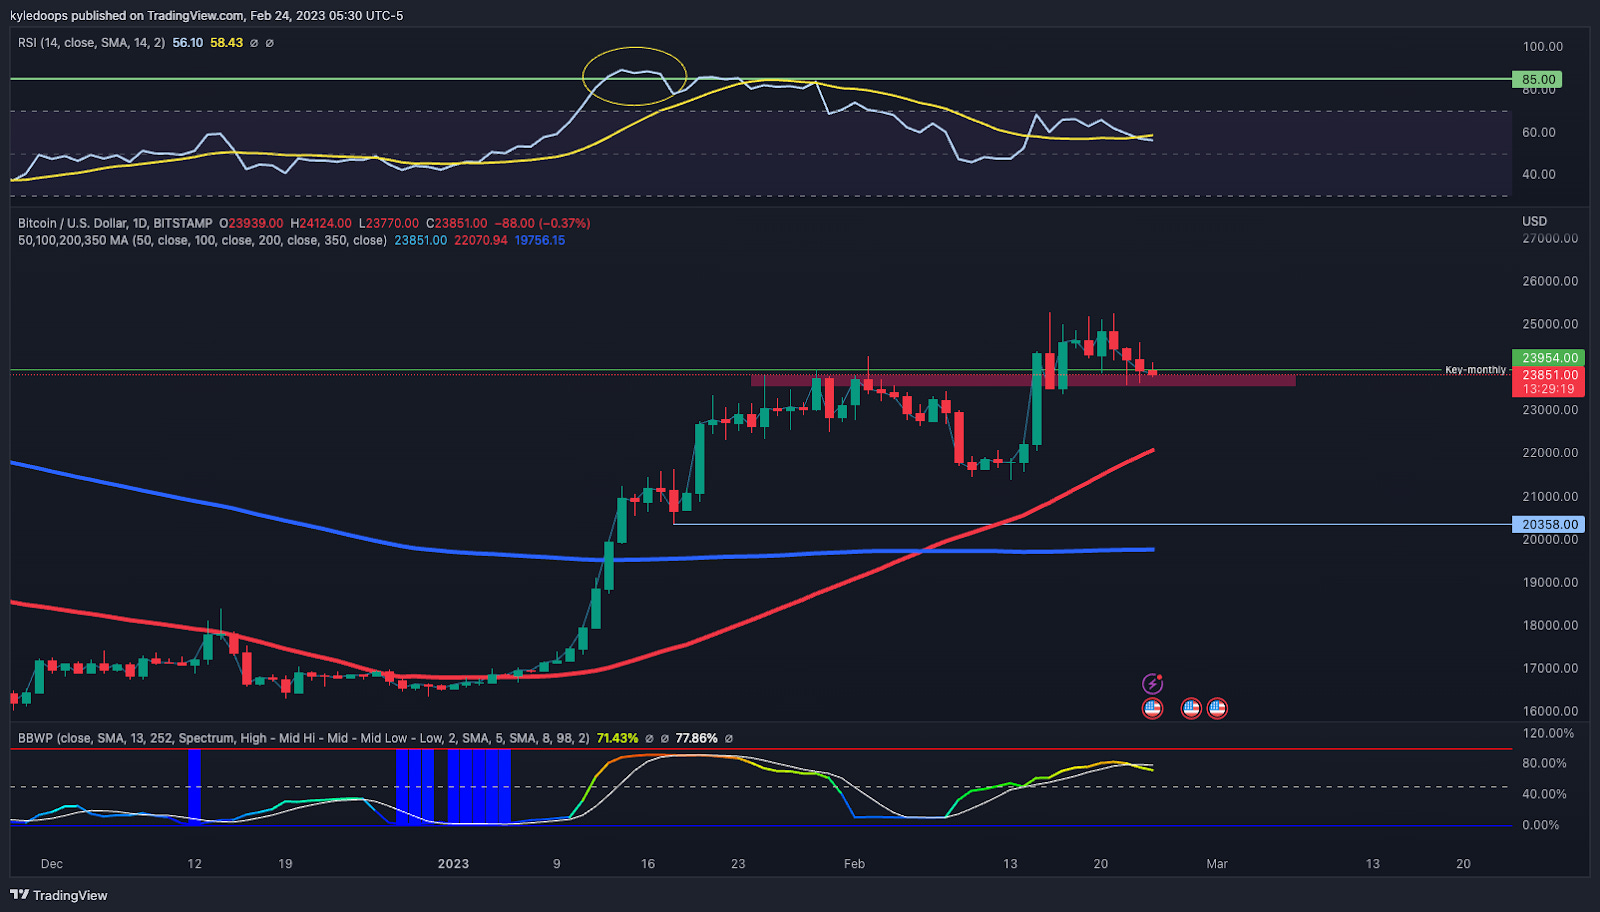
Chart #2 - Bitcoin (BTCUSD) 1-Day Chart
Chartist: Kyle
(For the chart screenshot, click here.)
Bulls will need to step in soon if they want prices to keep on rallying.
Bitcoin has a very crucial level it needs to hold at $23,500. If it breaches it and moves below, the next significant level is the 50-day moving average, coming in at $22,000. Losing that level would signify bears are starting to take back full control, and a lower low could become a reality.
Seeing how bitcoin is currently behaving, I suspect visiting the $22,000 level is becoming more and more likely.
Check our Crypto Banter Discord here for updates!
Make sure to follow me on Twitter, where I will post updates on my trades as they unfold!
Claim your Bitget sign-up bonuses here (details below).

Last week we went over some Advanced Options Trading Strategies. This week we will look at Options Trading Data Tables, also known as Options Chains. These are commonly used by traders to monitor the current prices and activity of various options contracts. The tables present key data points for each option contract in a tabular format, which typically includes the following information:
Ticker Symbol: The ticker symbol of the underlying asset (e.g. AAPL for Apple Inc.).
Expiration Date: The date on which the option contract expires.
Strike Price: The price at which the option contract can be exercised.
Call or Put: Indicates whether the option is a call or put option.
Last Price (Last): The most recent price at which the option contract traded.
Change (Chg): The change in the price of the option contract from the previous trading session.
Bid Price (Bid): The highest price at which a buyer is willing to purchase the option contract.
Ask Price (Ask): The lowest price at which a seller is willing to sell the option contract.
Volume (Vol): The total number of contracts that were traded during the trading session.
Open Interest (Open Int): The total number of outstanding contracts that have not been closed or exercised.
Implied Volatility (IV): A measure of the expected volatility of the underlying asset based on the current market prices of the option contracts.
Delta: A measure of the sensitivity of the option price to changes in the price of the underlying asset.
Gamma: A measure of the rate of change in the delta of an option in response to changes in the price of the underlying asset.
Theta: A measure of the rate at which the time value of an option contract decays as the expiration date approaches.
Rho: A measure of the sensitivity of the option price to changes in the interest rate.
Vega: Measures the sensitivity of an option's price to changes in the implied volatility of the underlying stock.
The last 5 points are part of what is known as Greeks in options trading. We looked over these in our February 10th edition of The Daily Candle which you can view here.
Traders use all this information to analyze and make decisions about trading options contracts, including determining which contracts to buy or sell, when to enter or exit a position, and how much to pay for an option contract.
If you missed our previous lessons on options trading, be sure to go back here to where we began the series, and check out each following Friday’s newsletter.
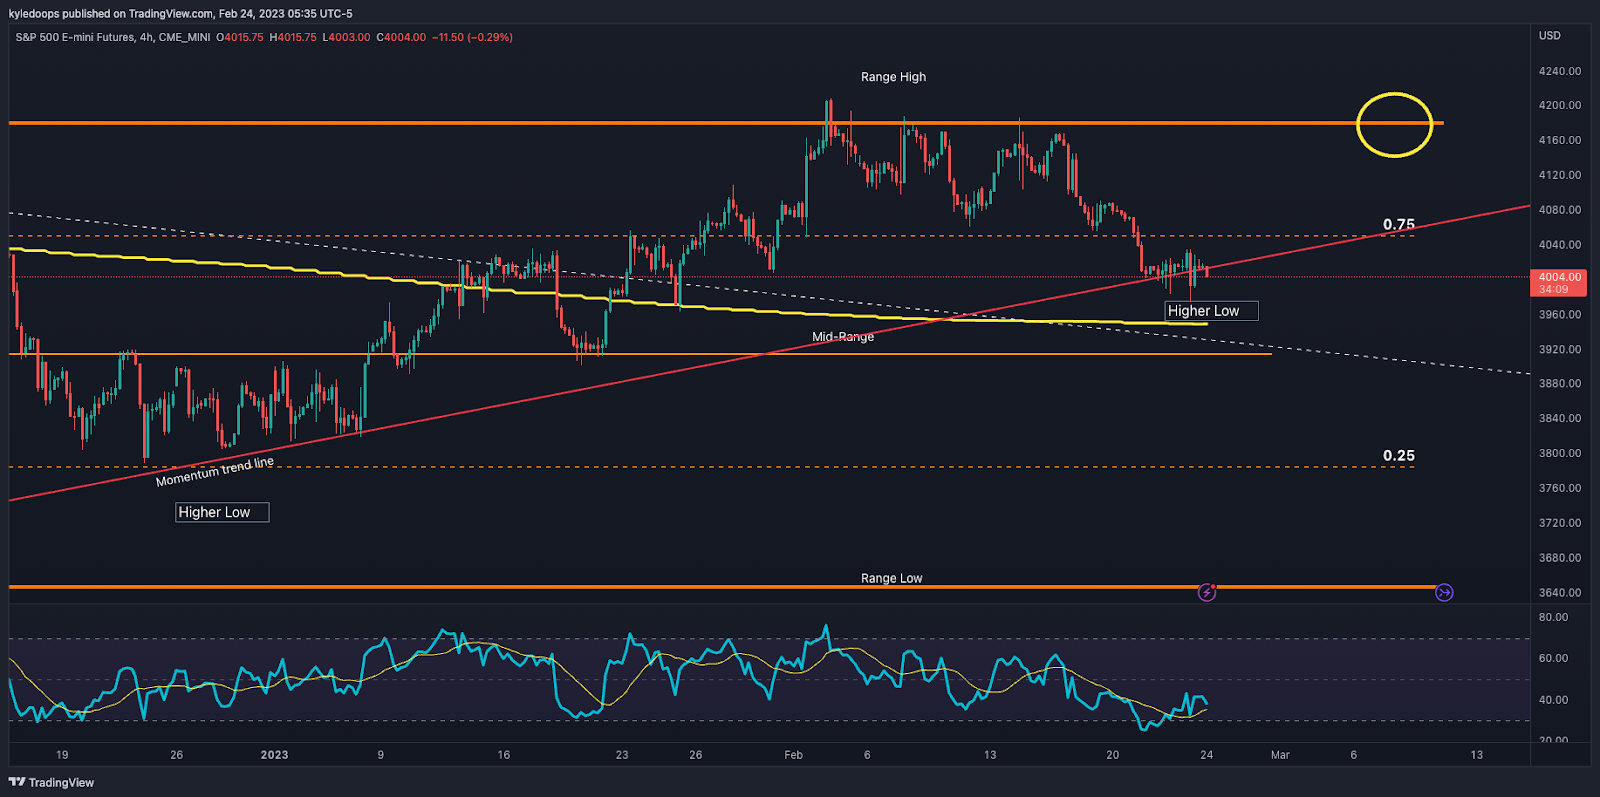
Chart #3 - S&P 500 4-Hour Chart
Chartist: Kyle
(For the chart screenshot, click here.)
The S&P 500 is not looking too good.
It is starting to break down below its trend line, which means the 200-day moving average becomes the next target at 3,948. If that level is lost, the next support is just under that, at its mid-range, at 3,915.
If that level is also lost, we will likely see bitcoin visit its range low around $18,000 again.
Check our Crypto Banter Discord here for updates!
Make sure to follow me on Twitter, where I will post updates on my trades as they unfold!
Claim your Bitget sign-up bonuses here (details below).
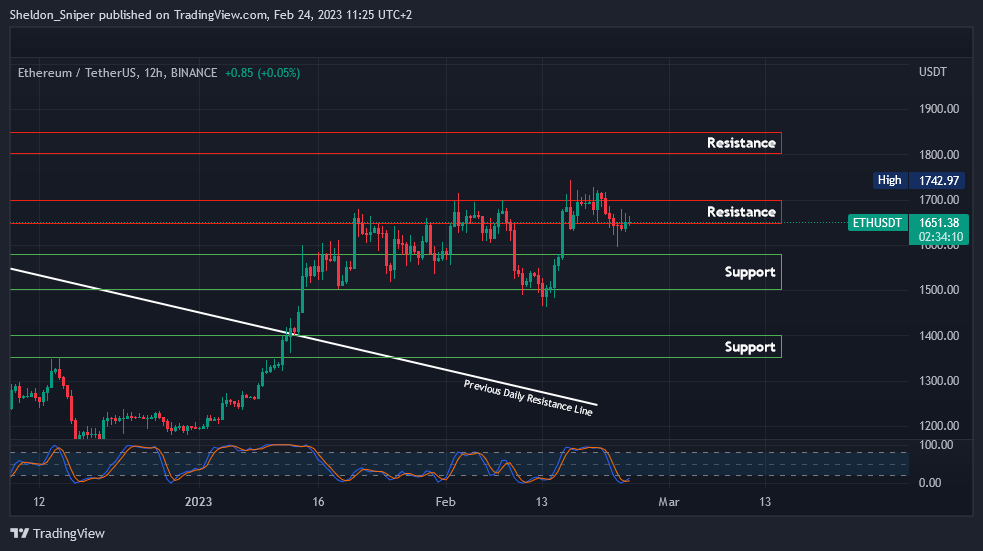
Chart #4 - Ethereum (ETHUSDT) 12-Hour Chart
Chartist: Sheldon
(For the chart screenshot, click here.)
ETH has spent the last three weeks testing the $1,650 - $1,700 resistance zone. And it hasn't been able to break above it.
But the last week has been relatively strong for ETH. If it can successfully break past $1,700 and retest the level as support, it could head up to $1,800 or possibly even $2,000 (bitcoin and stock market dependent).
But what happens if ETH decides to head down?
Dropping from here could see ETH visit its next support levels at $1,500 and $1,400. But, ETH has been getting a lot of attention lately. So, I think it could be preparing to move higher over the next couple of weeks.
Check our Crypto Banter Discord here for updates!
Follow me on Twitter to get all the updates on my personal trading progress!
Claim your Bitget sign-up bonuses here (details below).
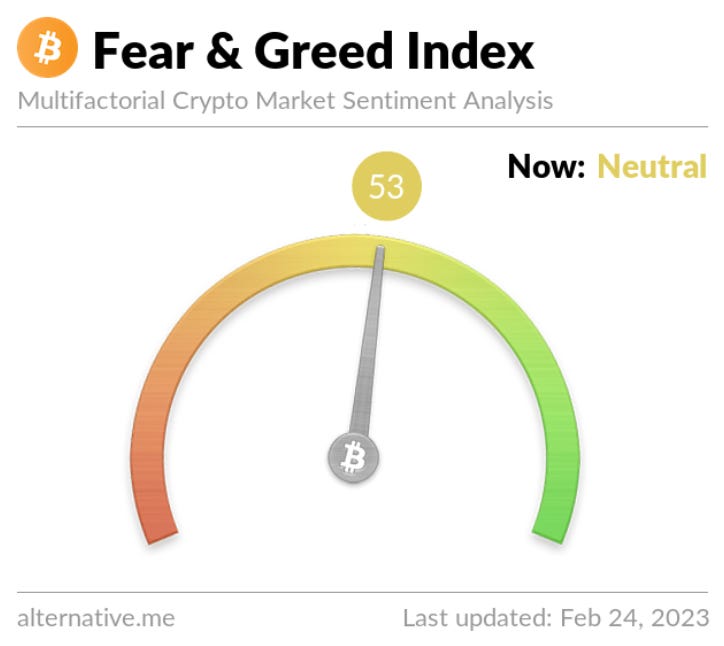
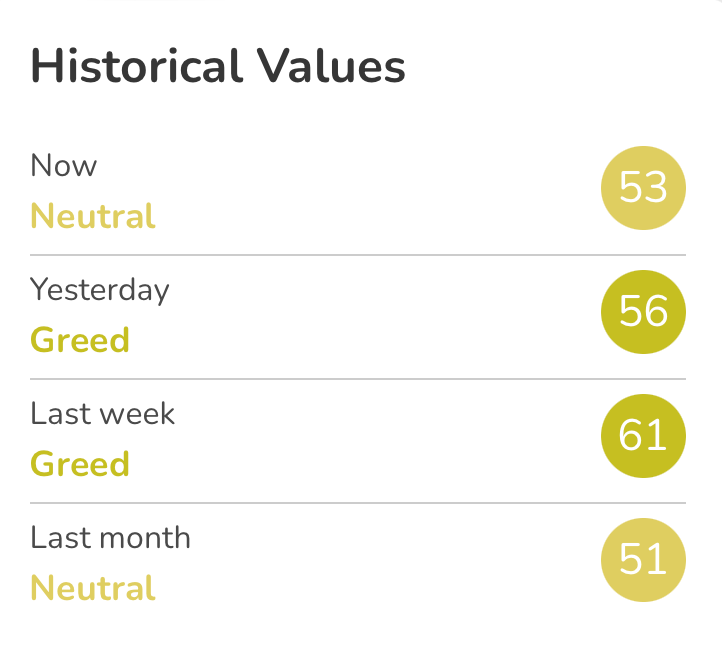
Chart #5 - Bitcoin Fear and Greed Index
The Bitcoin Fear and Greed Index is sitting at 53 today, Neutral.
The highest the index has been over the past seven days is 60, and the lowest is 53.

Overall Market Sentiment (Banter’s Take)
Bitcoin finds itself under immense pressure as the S&P 500 sells off.
As it remains at the mercy of the traditional market, only a potential stock market pump could help save bitcoin from visiting its range low. This would mean a wider crypto market price drop and sell-offs across the board.
Stay safe my friends!
Bybit winner - 7741620